Analyze HTTP Traffic with new HTTP Instrument
Understanding new HTTP Instrument Xcode
WWDC21 has been finished last week with over 200 sessions. Most of the time we heard about SwiftUI session or about Async Await. However there are also interesting session about debugging that has been described by Keith Harrison here. In this article I would like to focus on one of the underrated session which is Analyze HTTP Traffic in Instruments. I also write this article in WWDC Notes.
All content copyright © 2012 – 2021 Apple Inc. All rights reserved. Swift, the Swift logo, Swift Playgrounds, Xcode, Instruments, Cocoa Touch, Touch ID, FaceID, iPhone, iPad, Safari, App Store, iPadOS, watchOS, tvOS, Mac, and macOS are trademarks of Apple Inc., registered in the U.S. and other countries. This article is not made by, affiliated with, nor endorsed by Apple.
Track hierarchy
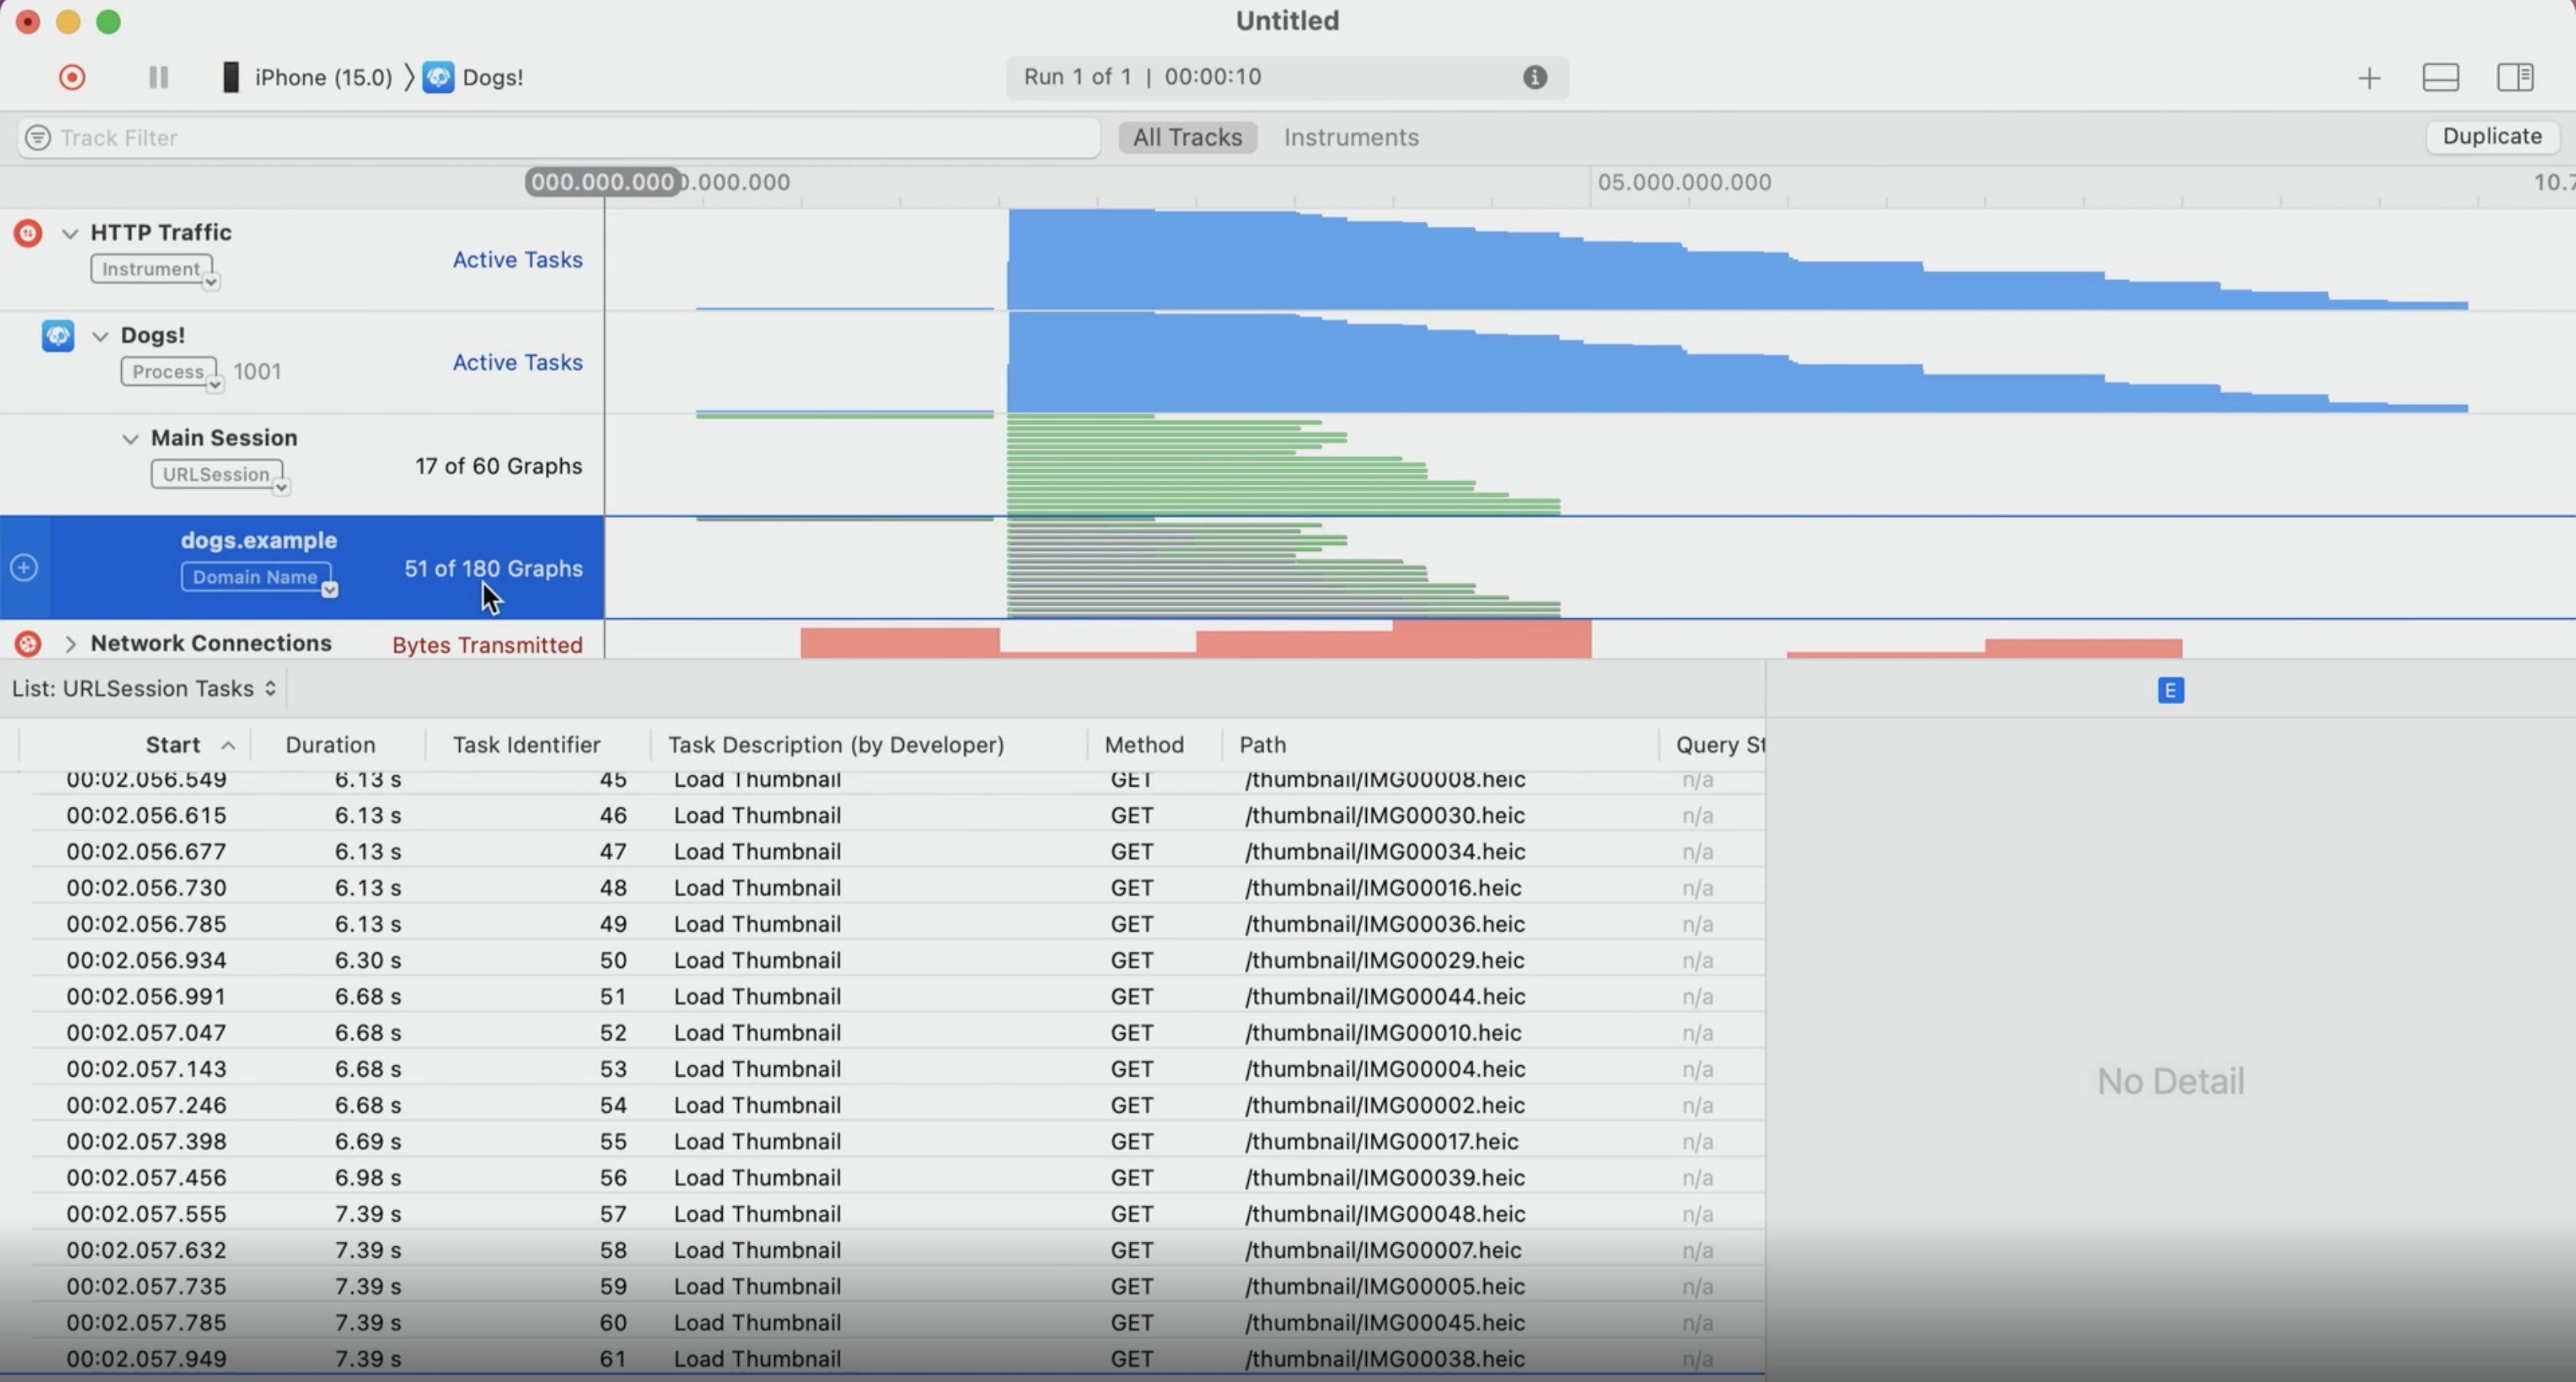
First is about track hierarchy. The hierarchy consists of 4 important elements :
- HTTP Traffic instruments : Number of active tasks presented
- Process : Debuggable process and background tasks daemon
- Session : Session will shown one track per
URLSessionobject. During those session there will be an individual task intervals. Besides that, we can configure the session name for more clarity.
1let session = URLSession(configuration: .default)
2session.sessionDescription = "Main Session" // 👈🏻 Custom session name- Domain
- Only task that requested in the domain
- Give more detail about tasks
- Showing individual transactions
- Describing the transaction states
Task timing
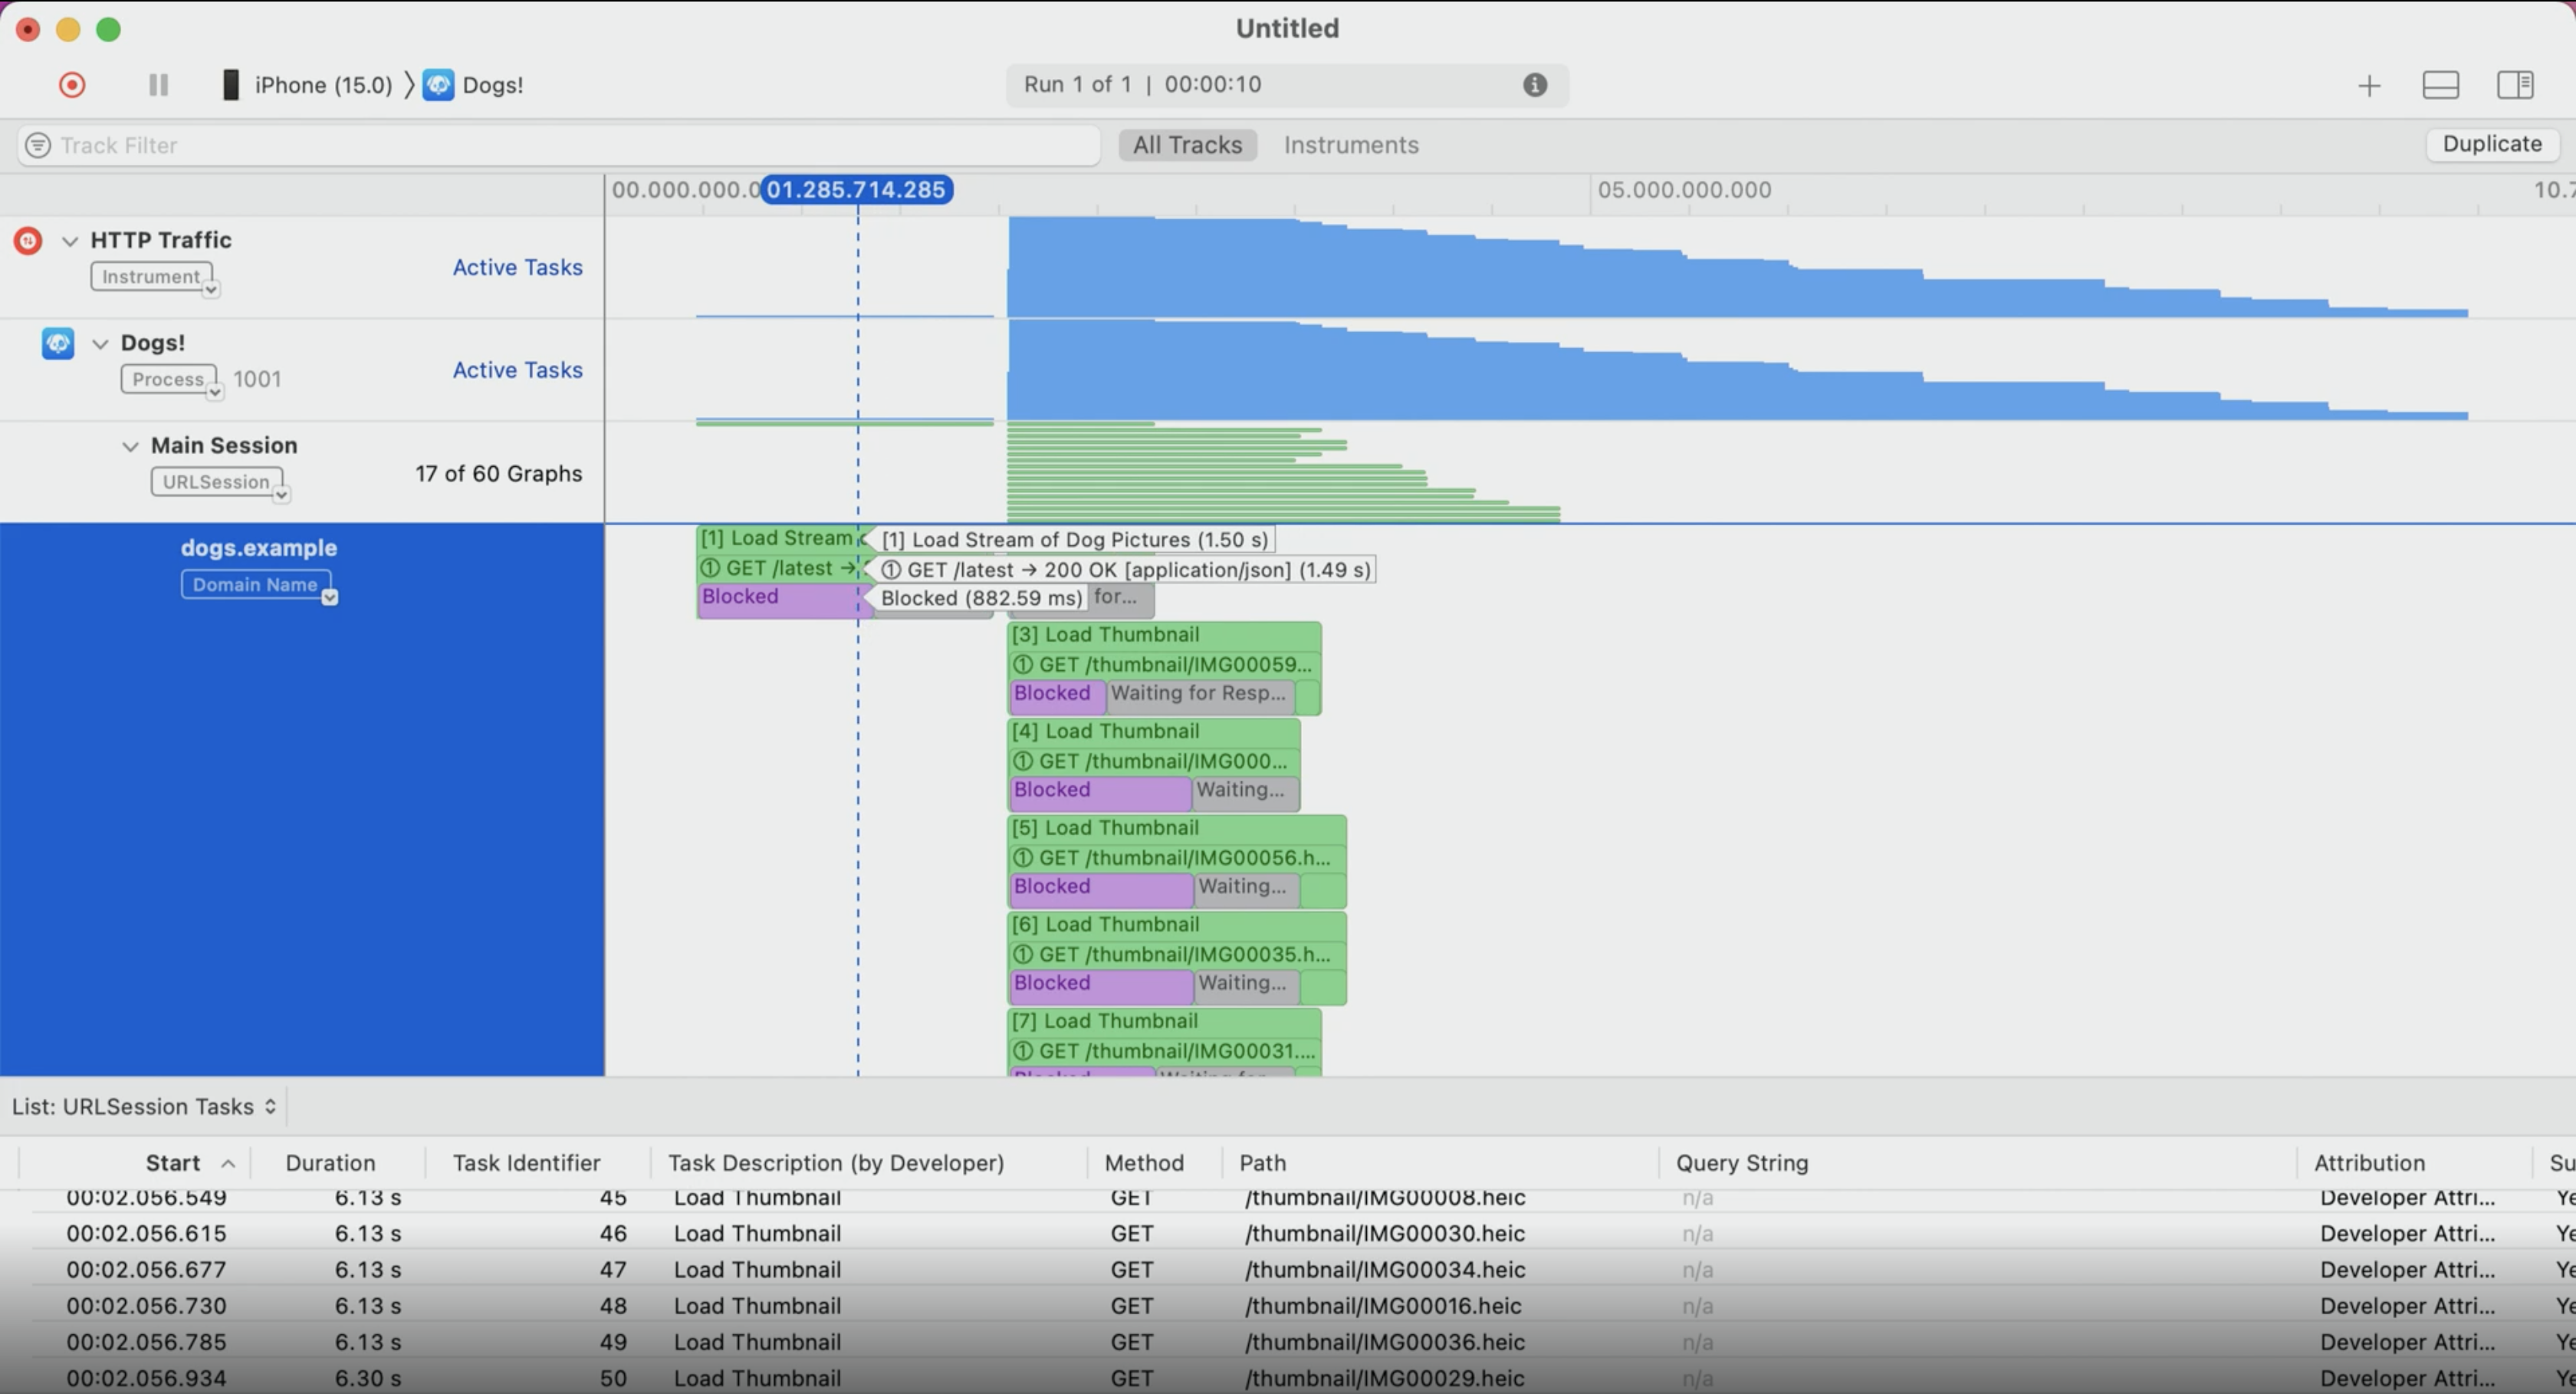
Task timing is also part of the instruments GUI. We will able to see structural timing from the start of the request until the end of the request
1let task = session.dataTask(with: url) {
2	/* handle result */ // 👈🏻 Complete event triggers here
3}
4
5task.resume() // 👈🏻 Resume event triggers here
Task Identifier
Besides task timing, we also able to let instrument know to show the task identifier next to the description name. Give a task identifier for clarity.
1let task = session.dataTask(with: url) {
2 /* handle result */
3}
4task.taskDescription = "Load Thumbnail"
5task.resume()
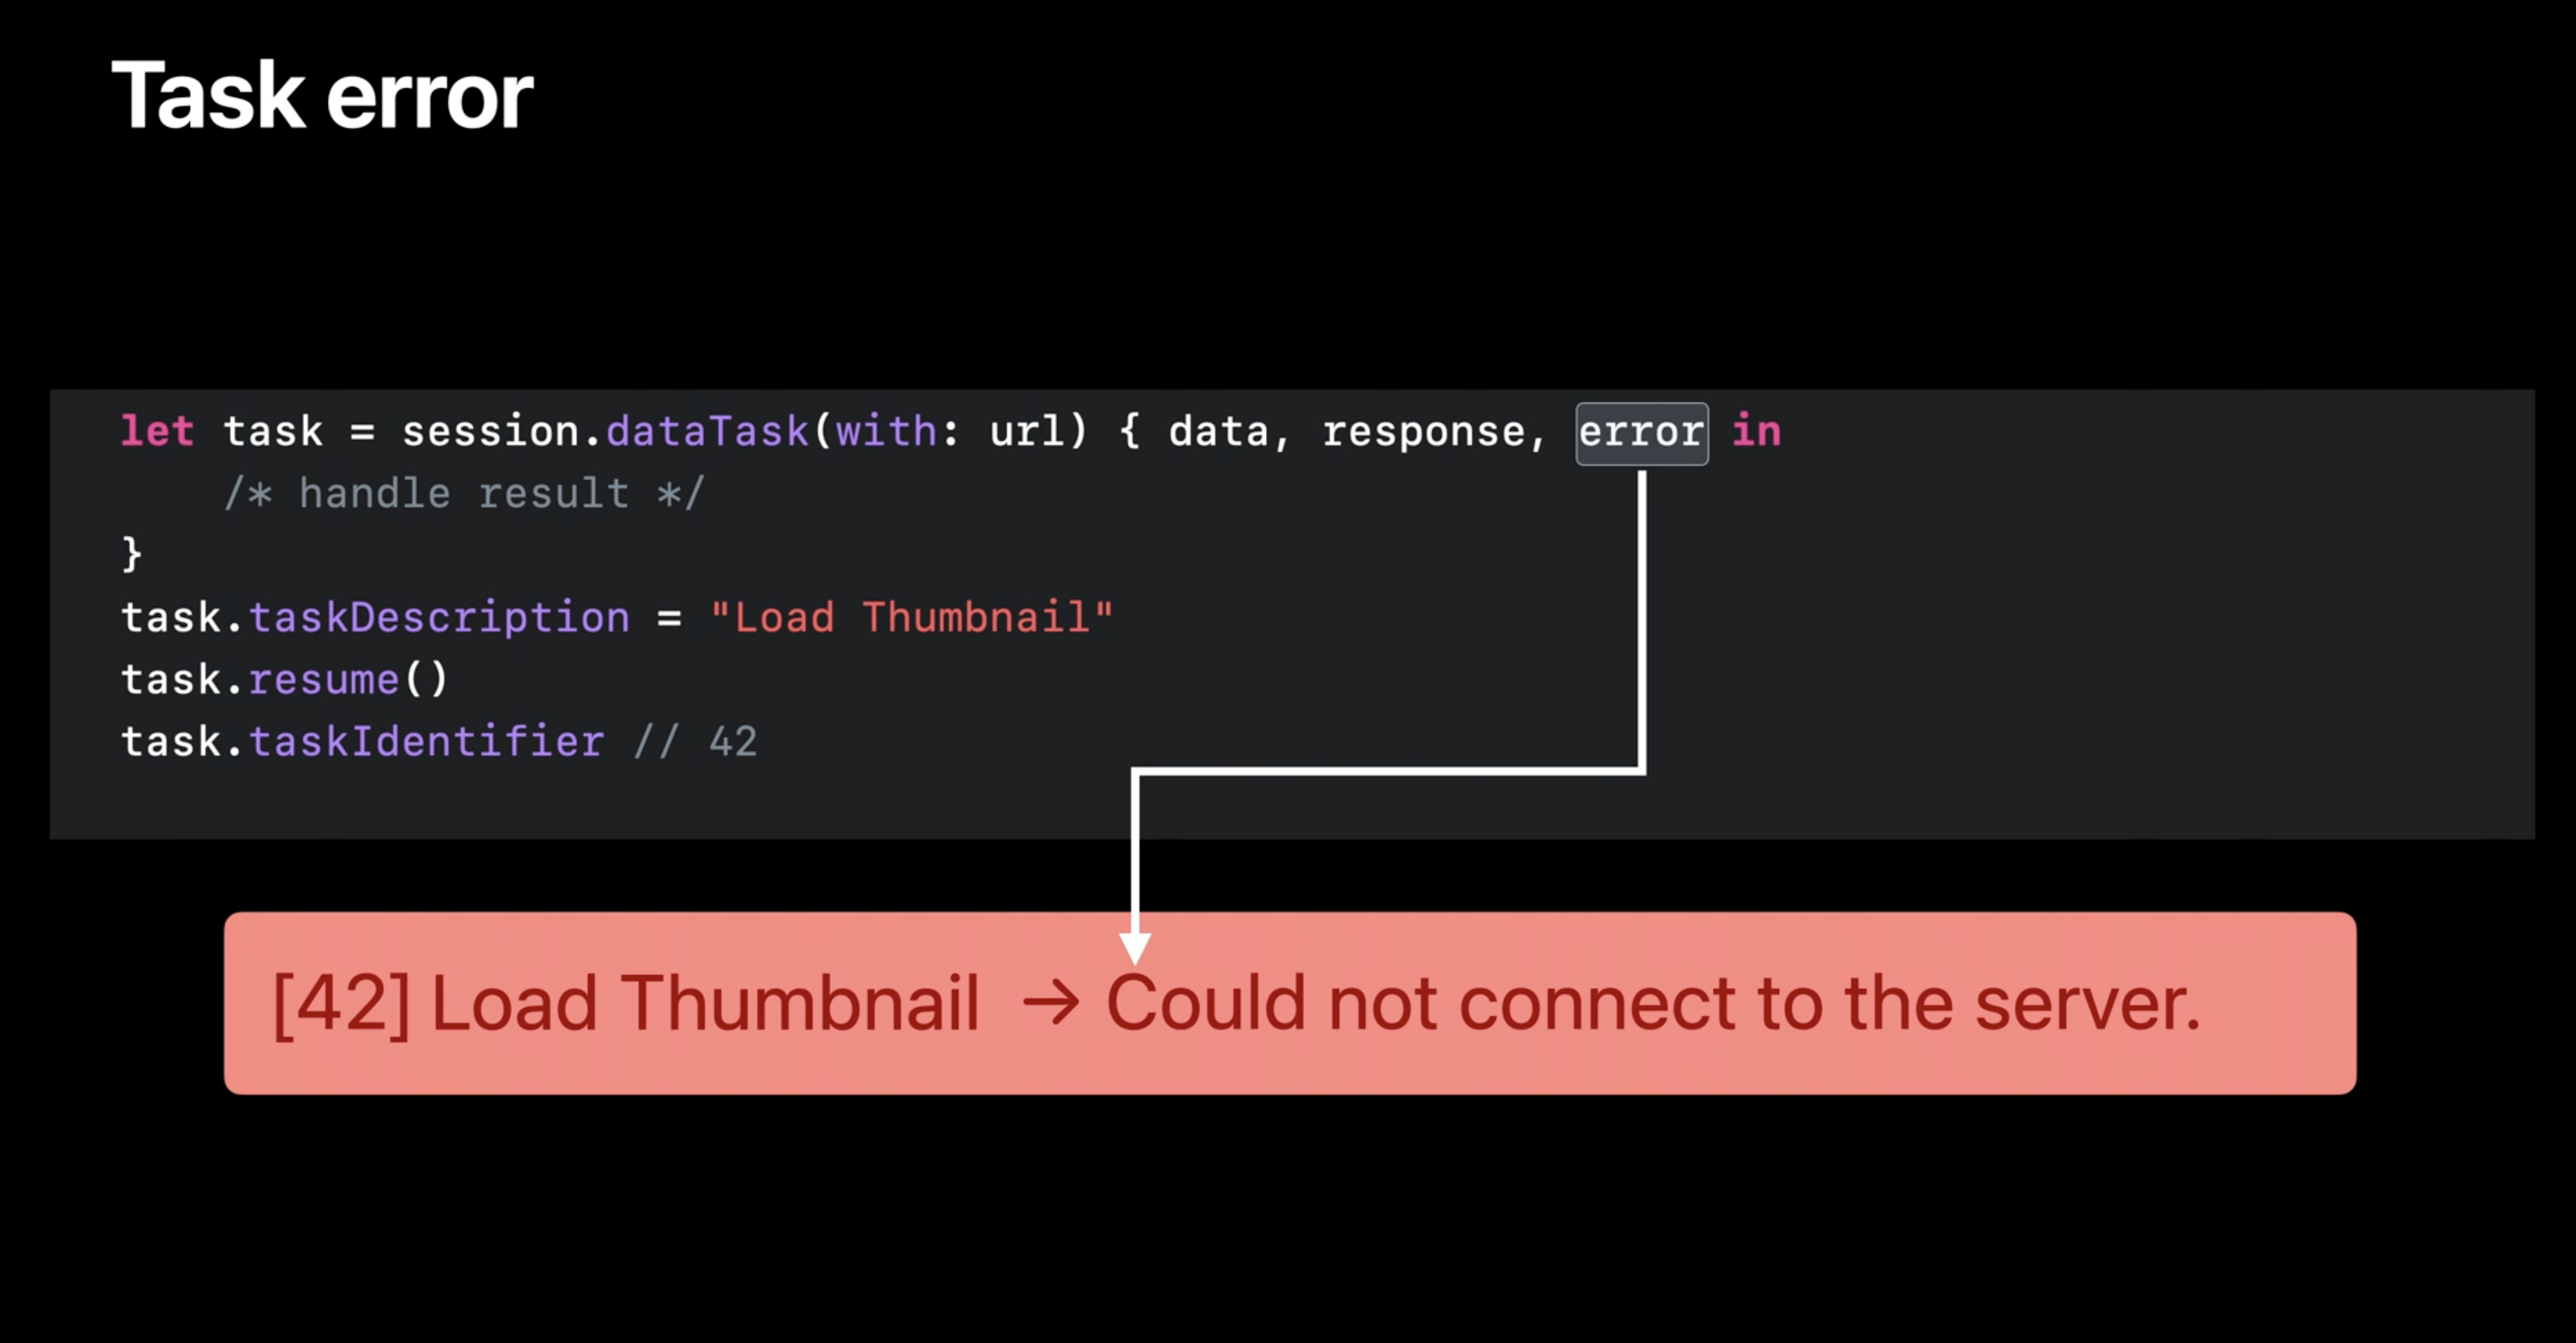
6task.taskIdentifier // 👈🏻 this identifier will be shown in instrumentsTask Error
Task error is giving an ability for us to distinguish error and success with a color in the Instruments (normally red for an error)
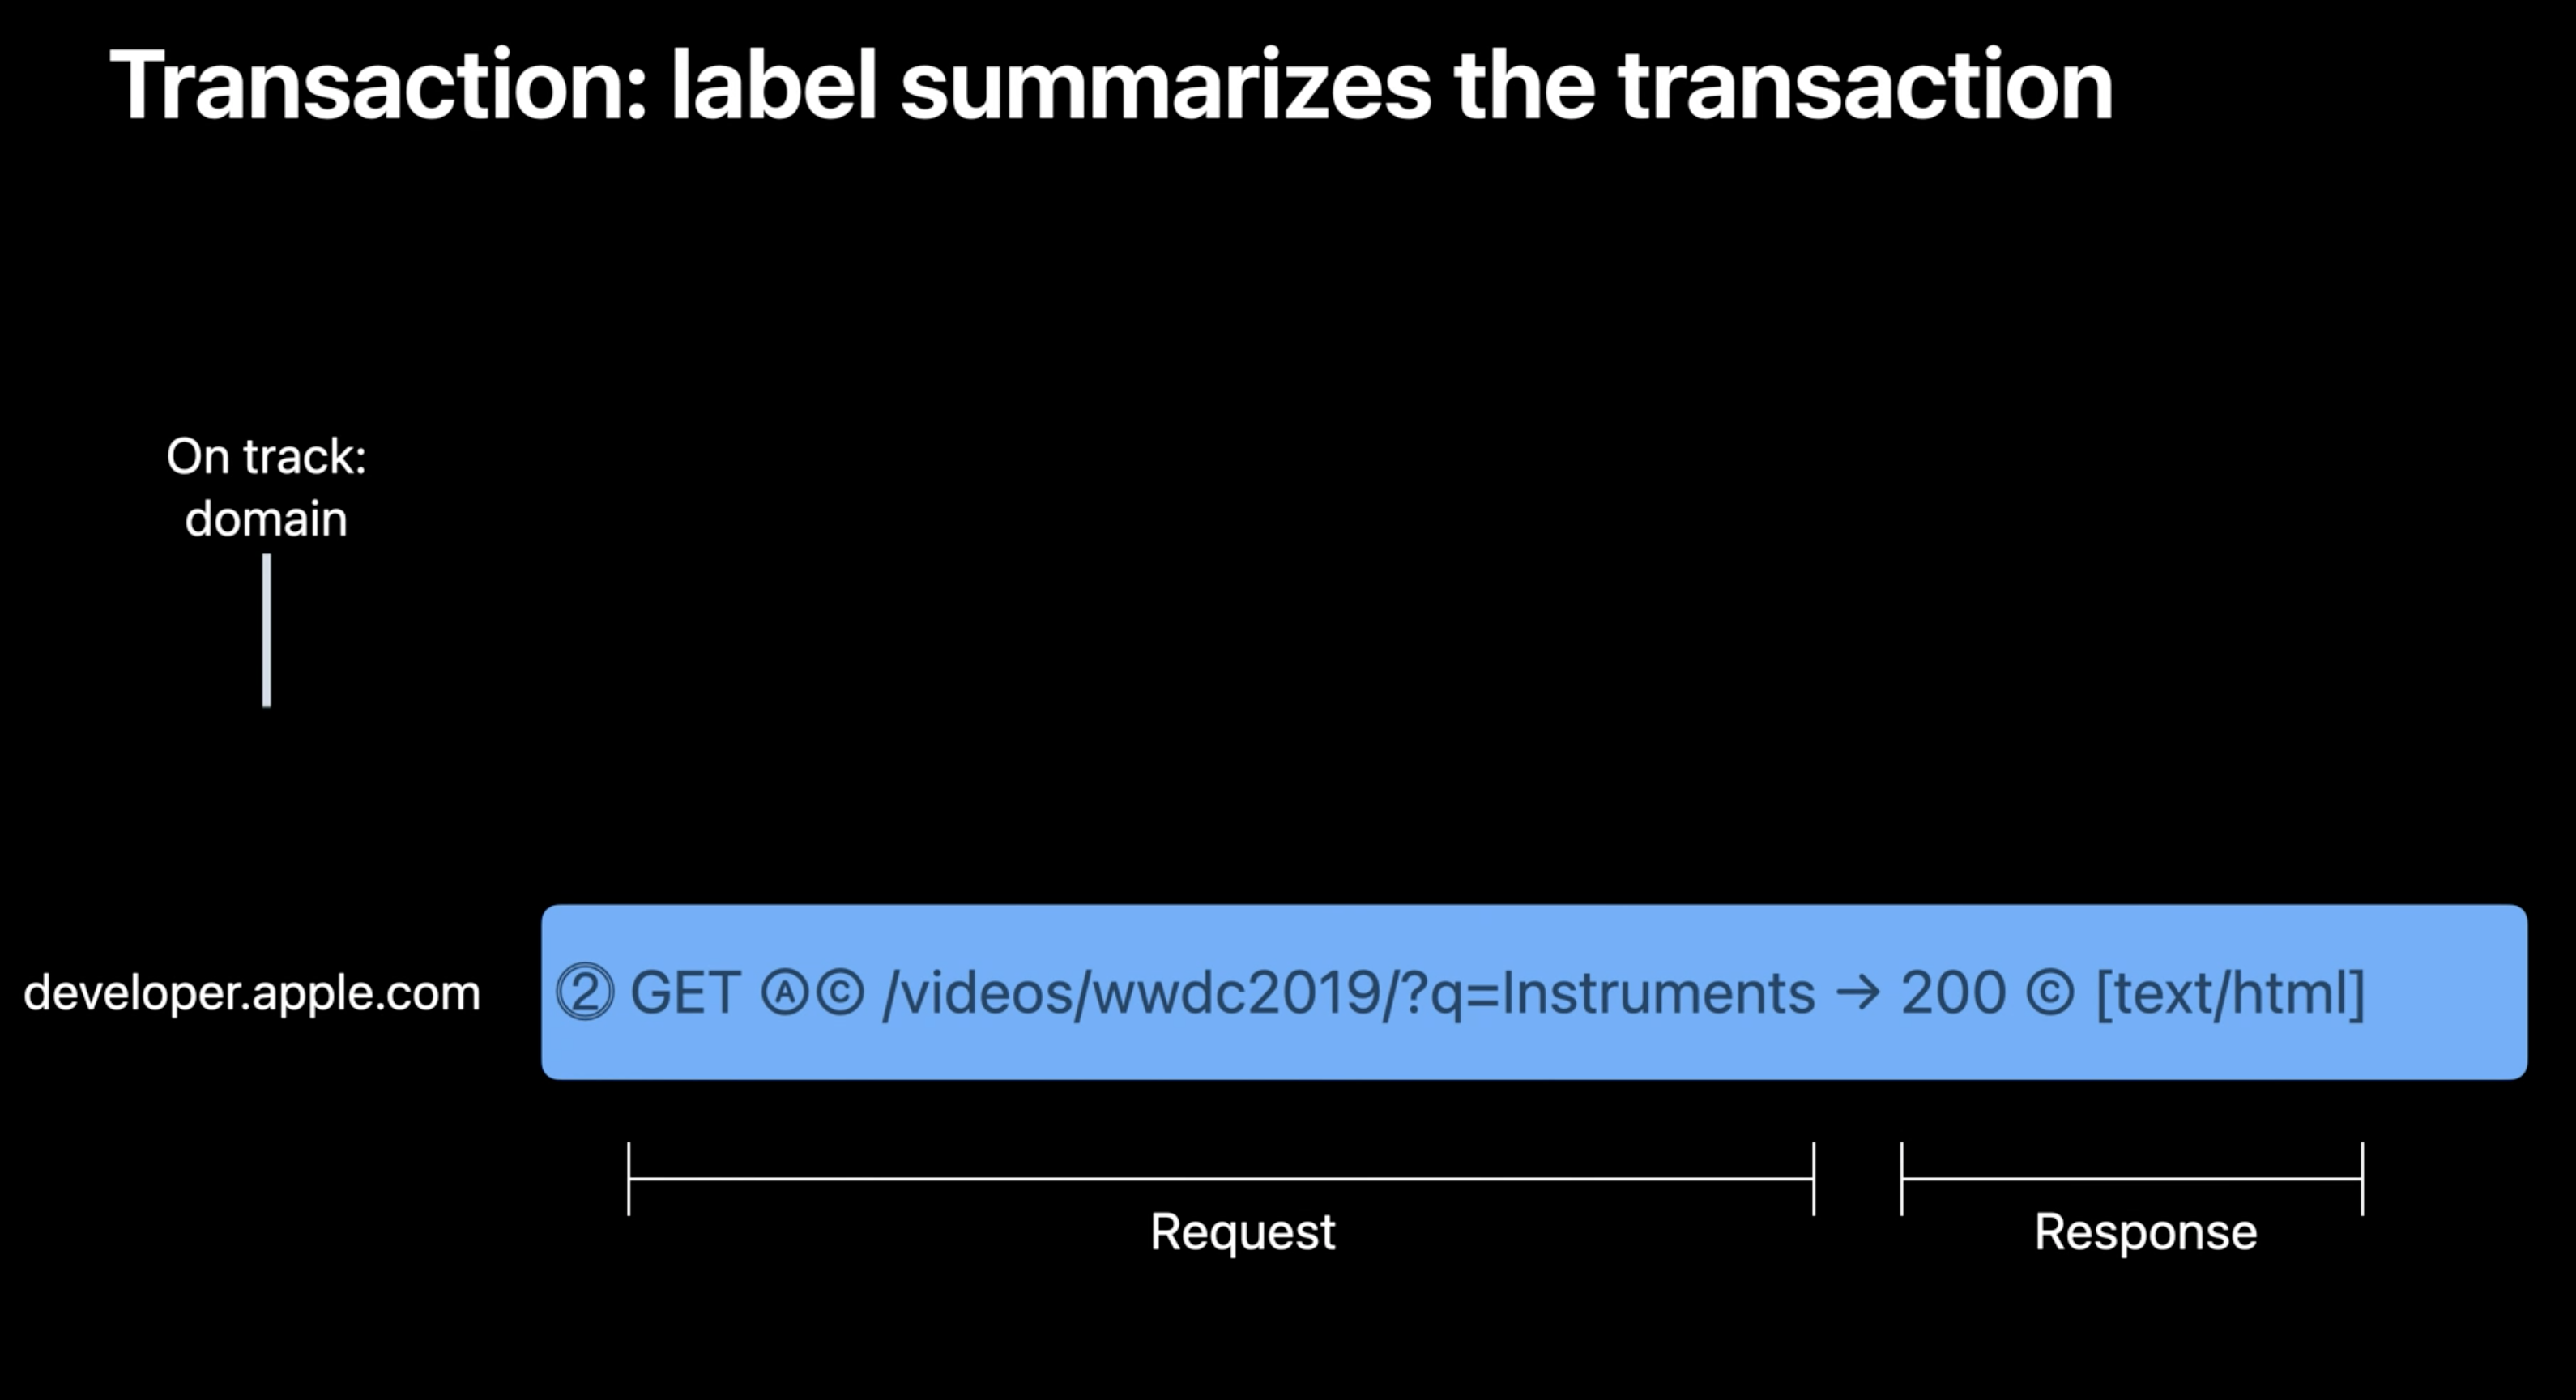
Transactions
Transactions are part of how instrument is breaking down the whole task timing. Request and response pair is being handled by the URL Loading system by default. Transactions contains all the HTTP layer information such as URL, HTTP Version, Connection and cache info. They also have information regarding Request and Response header alongside with the Request and Response body.
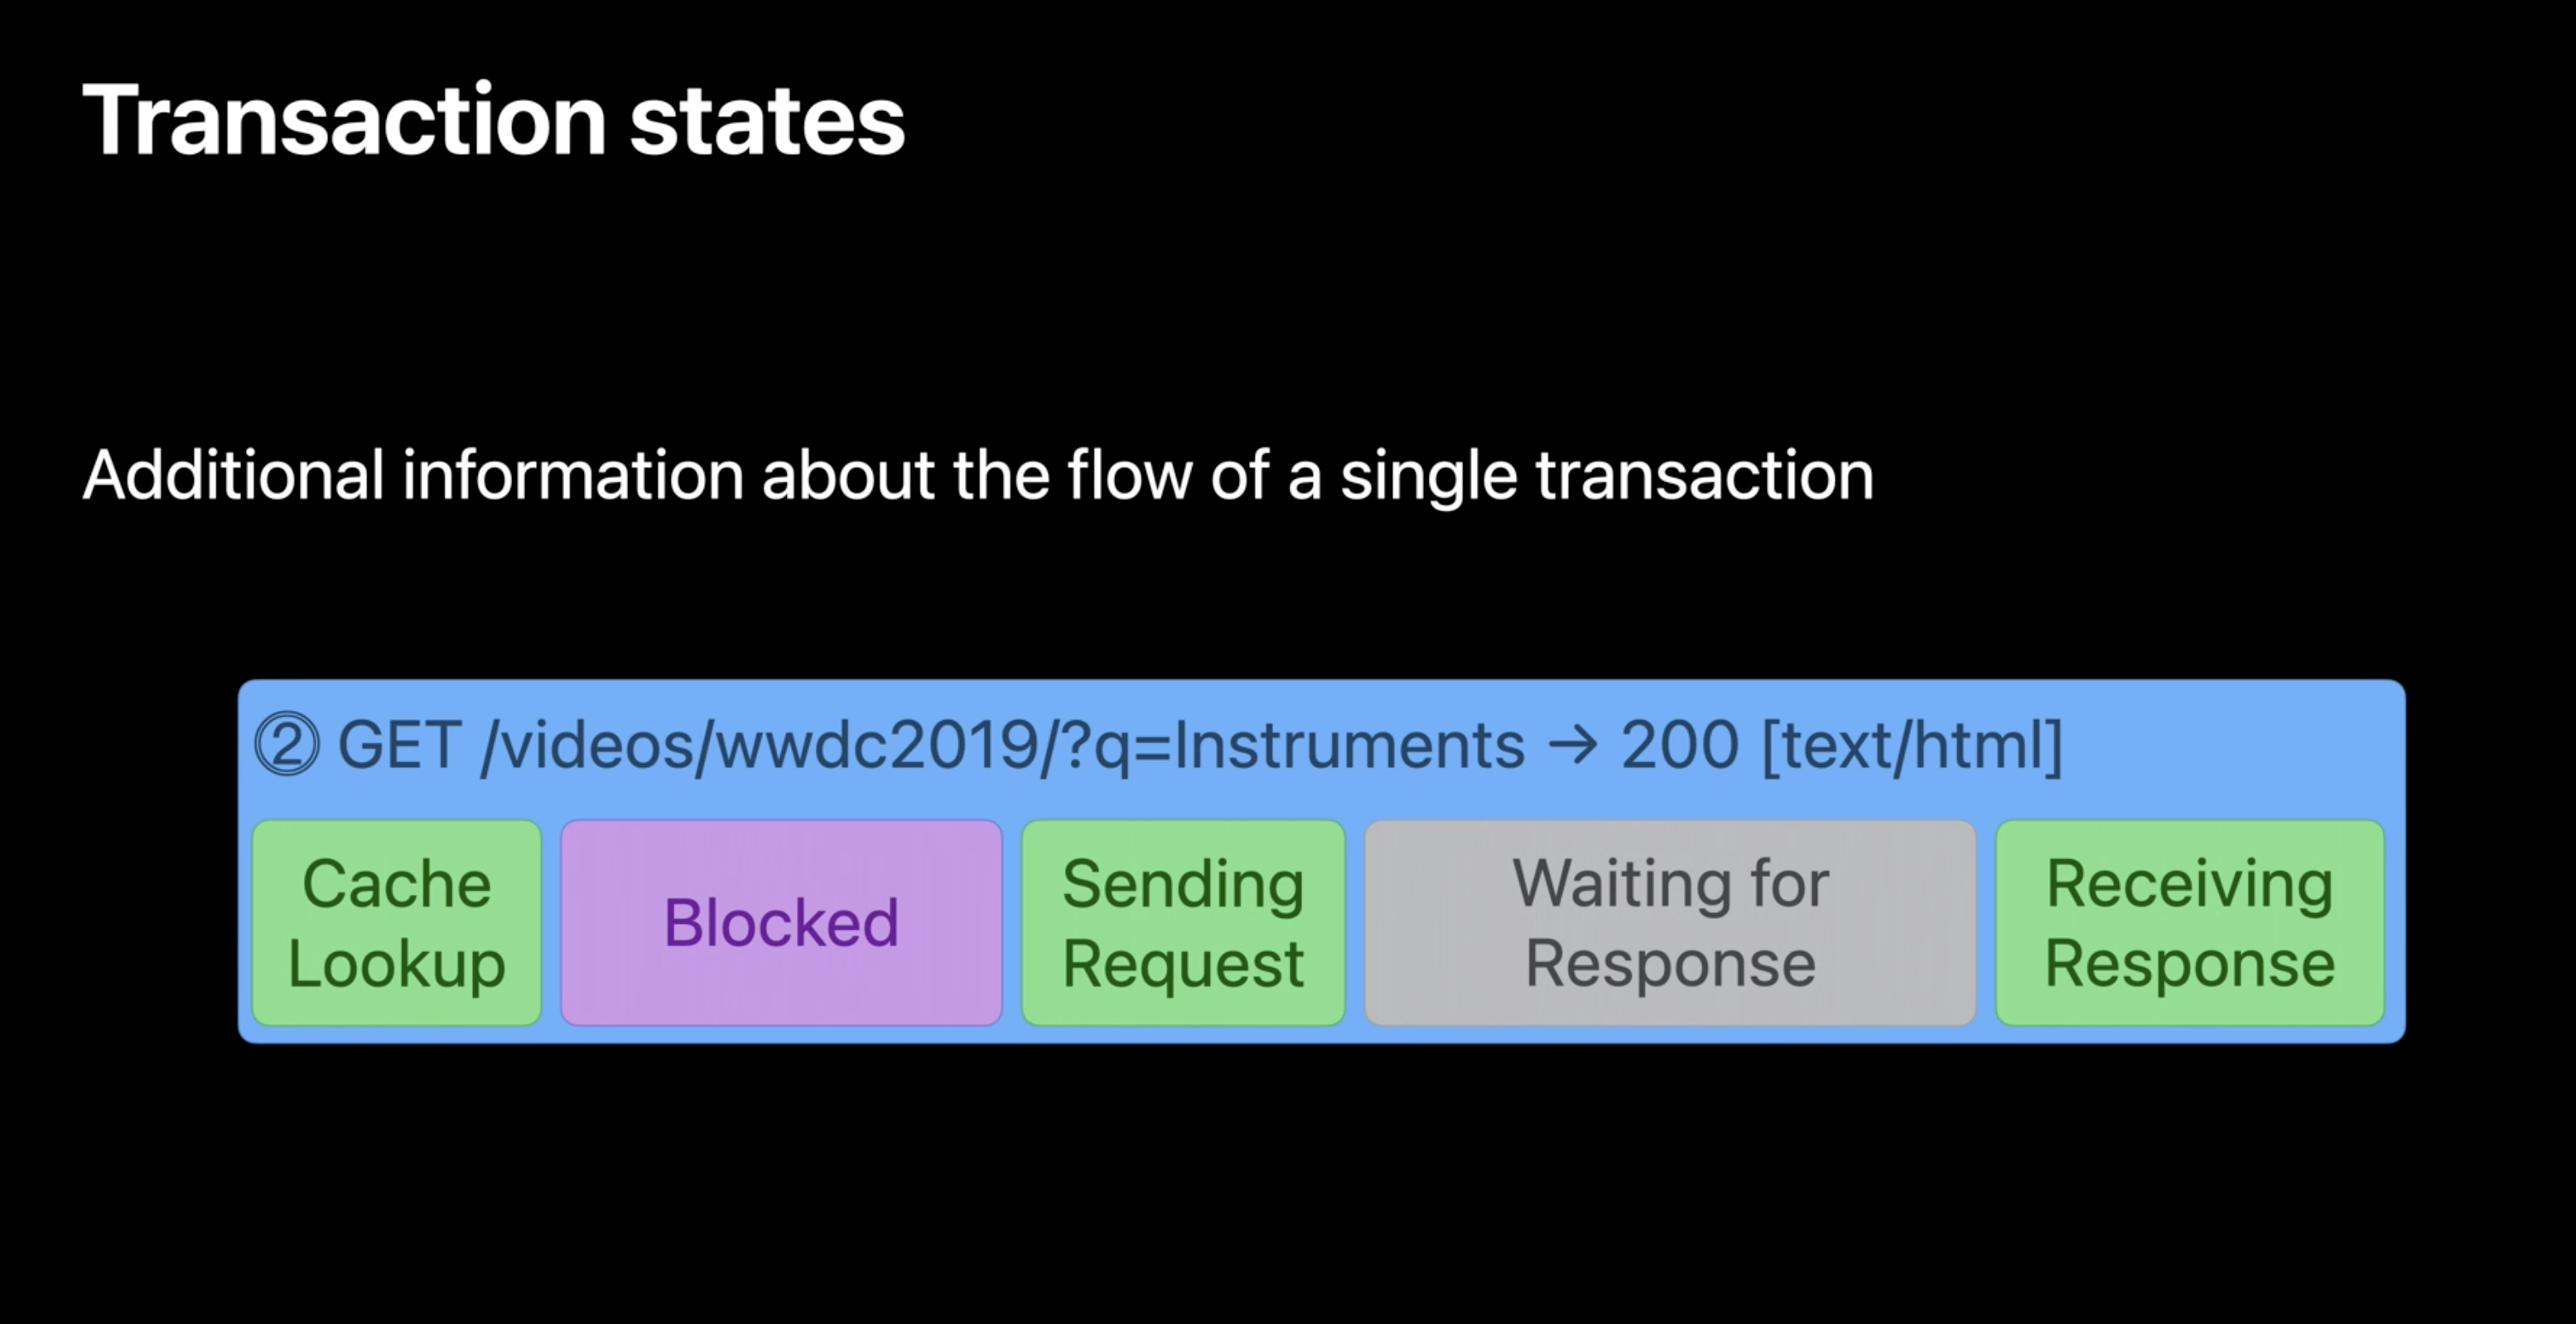
Transaction states
Another important chunk of information in Instruments are there are multiple states within the transaction for distinction between each block that described in each state. Each state also showing different timing on each layers.
Instrument
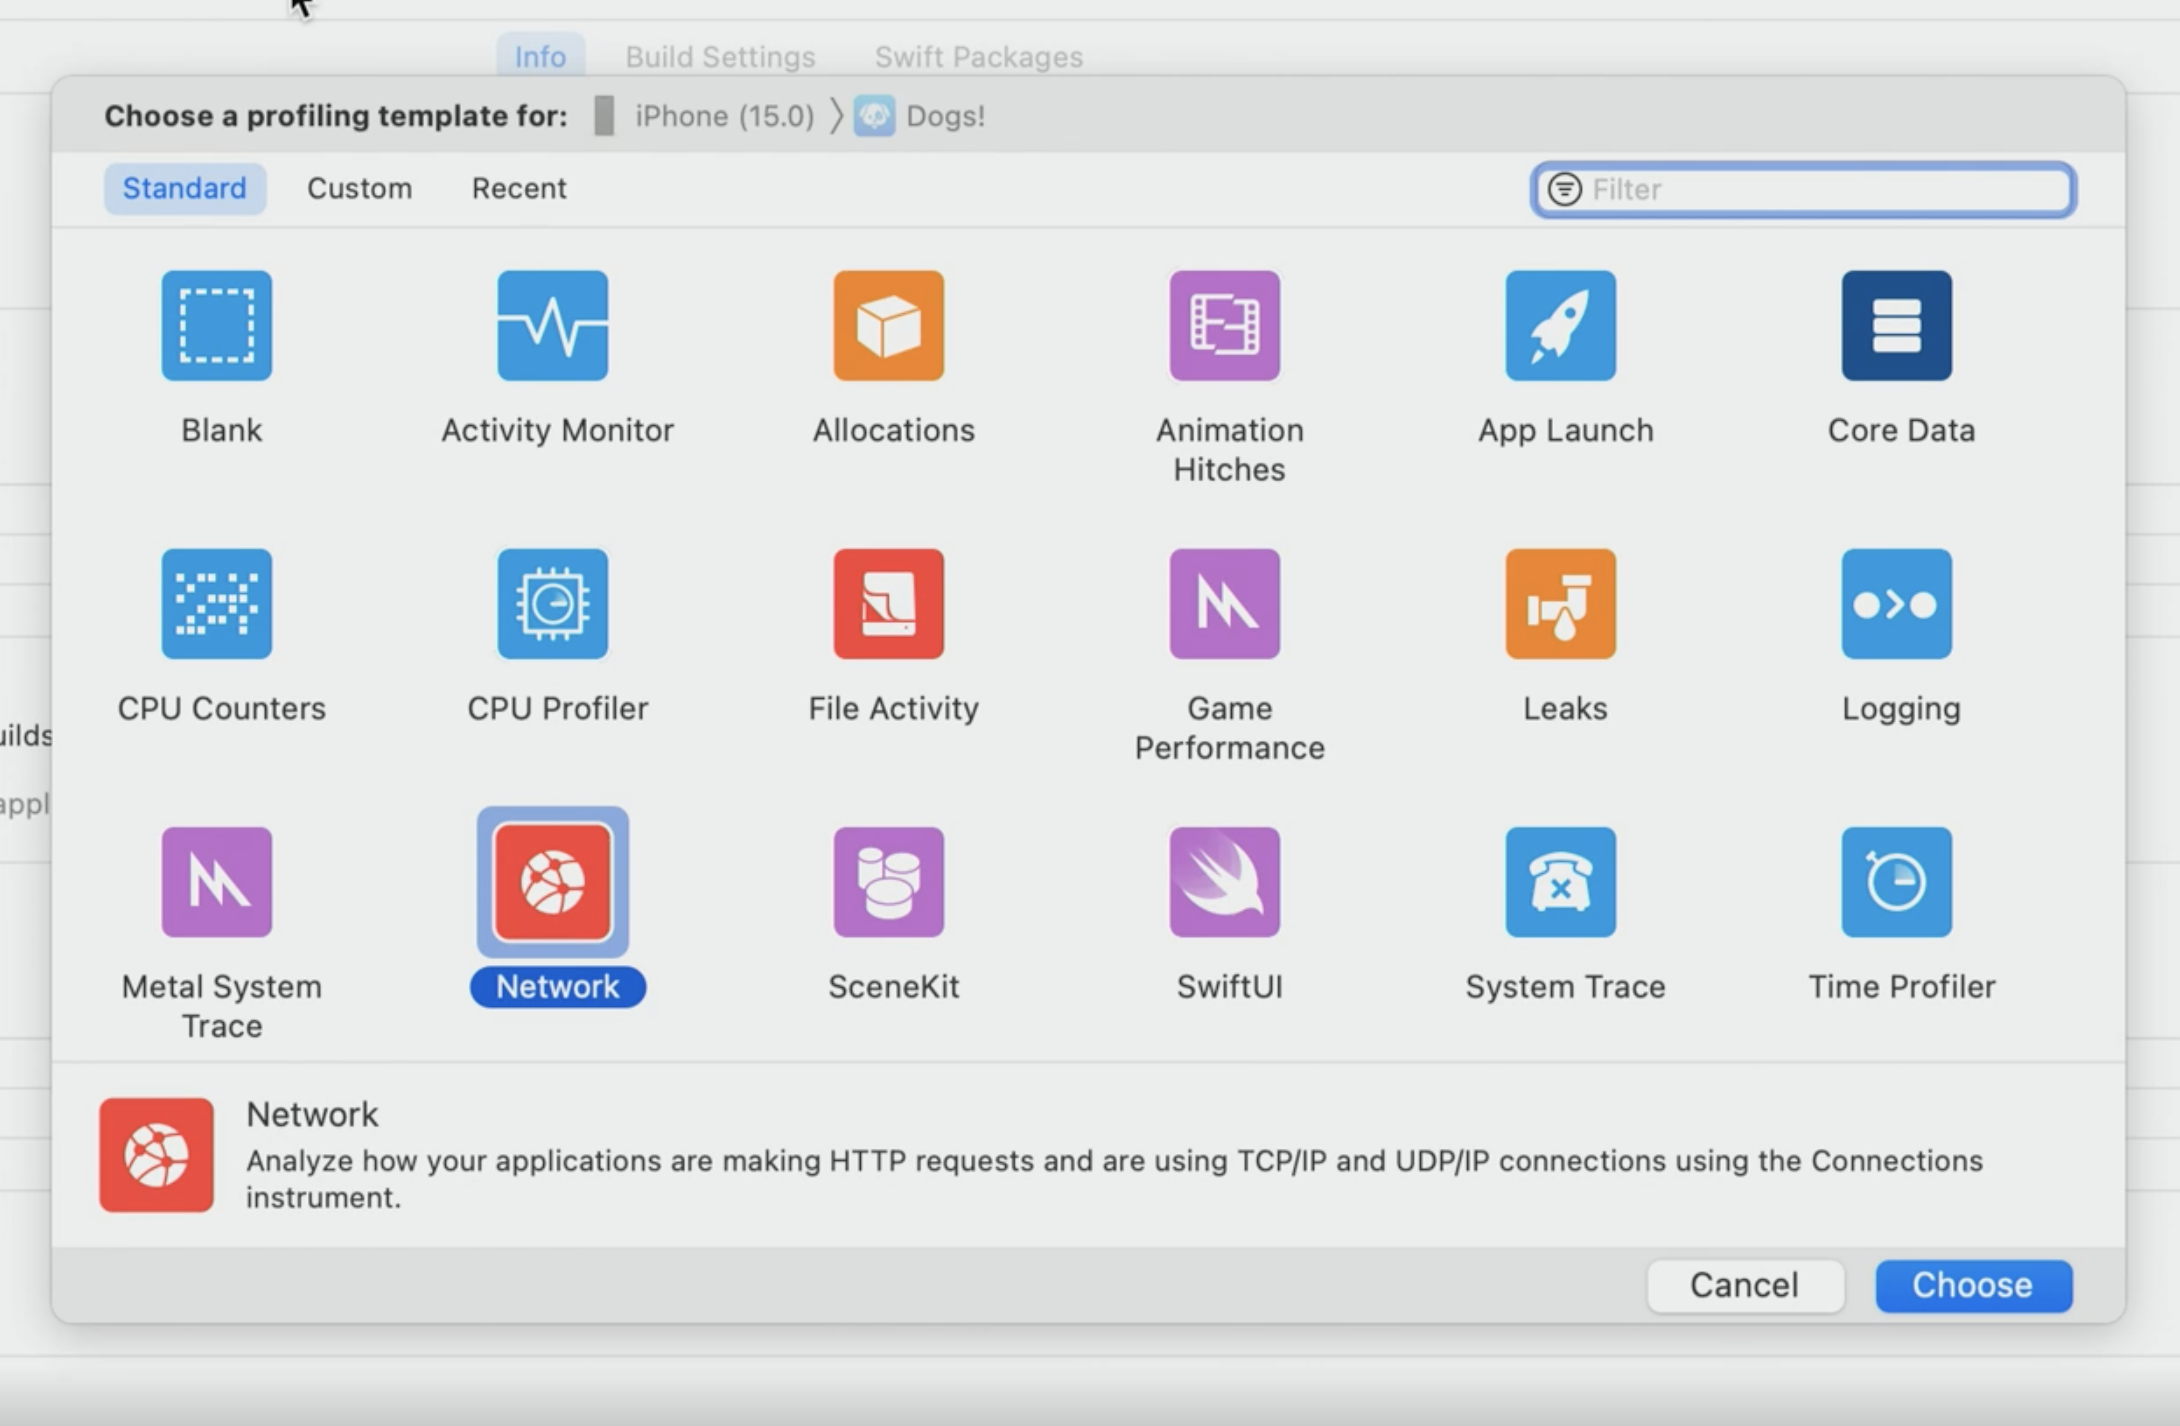
Next there are several step that we can do with the HTTP instrument:
- Focus on the task description
- Here we can just click on the task that we want, especially if we have already set the description name we can click on it.
- Expand the task description
- We can expand the specific task description for getting more detailed information on that specific tasks. We also able to drag our pointer to specific timeline to show more compact version of it.
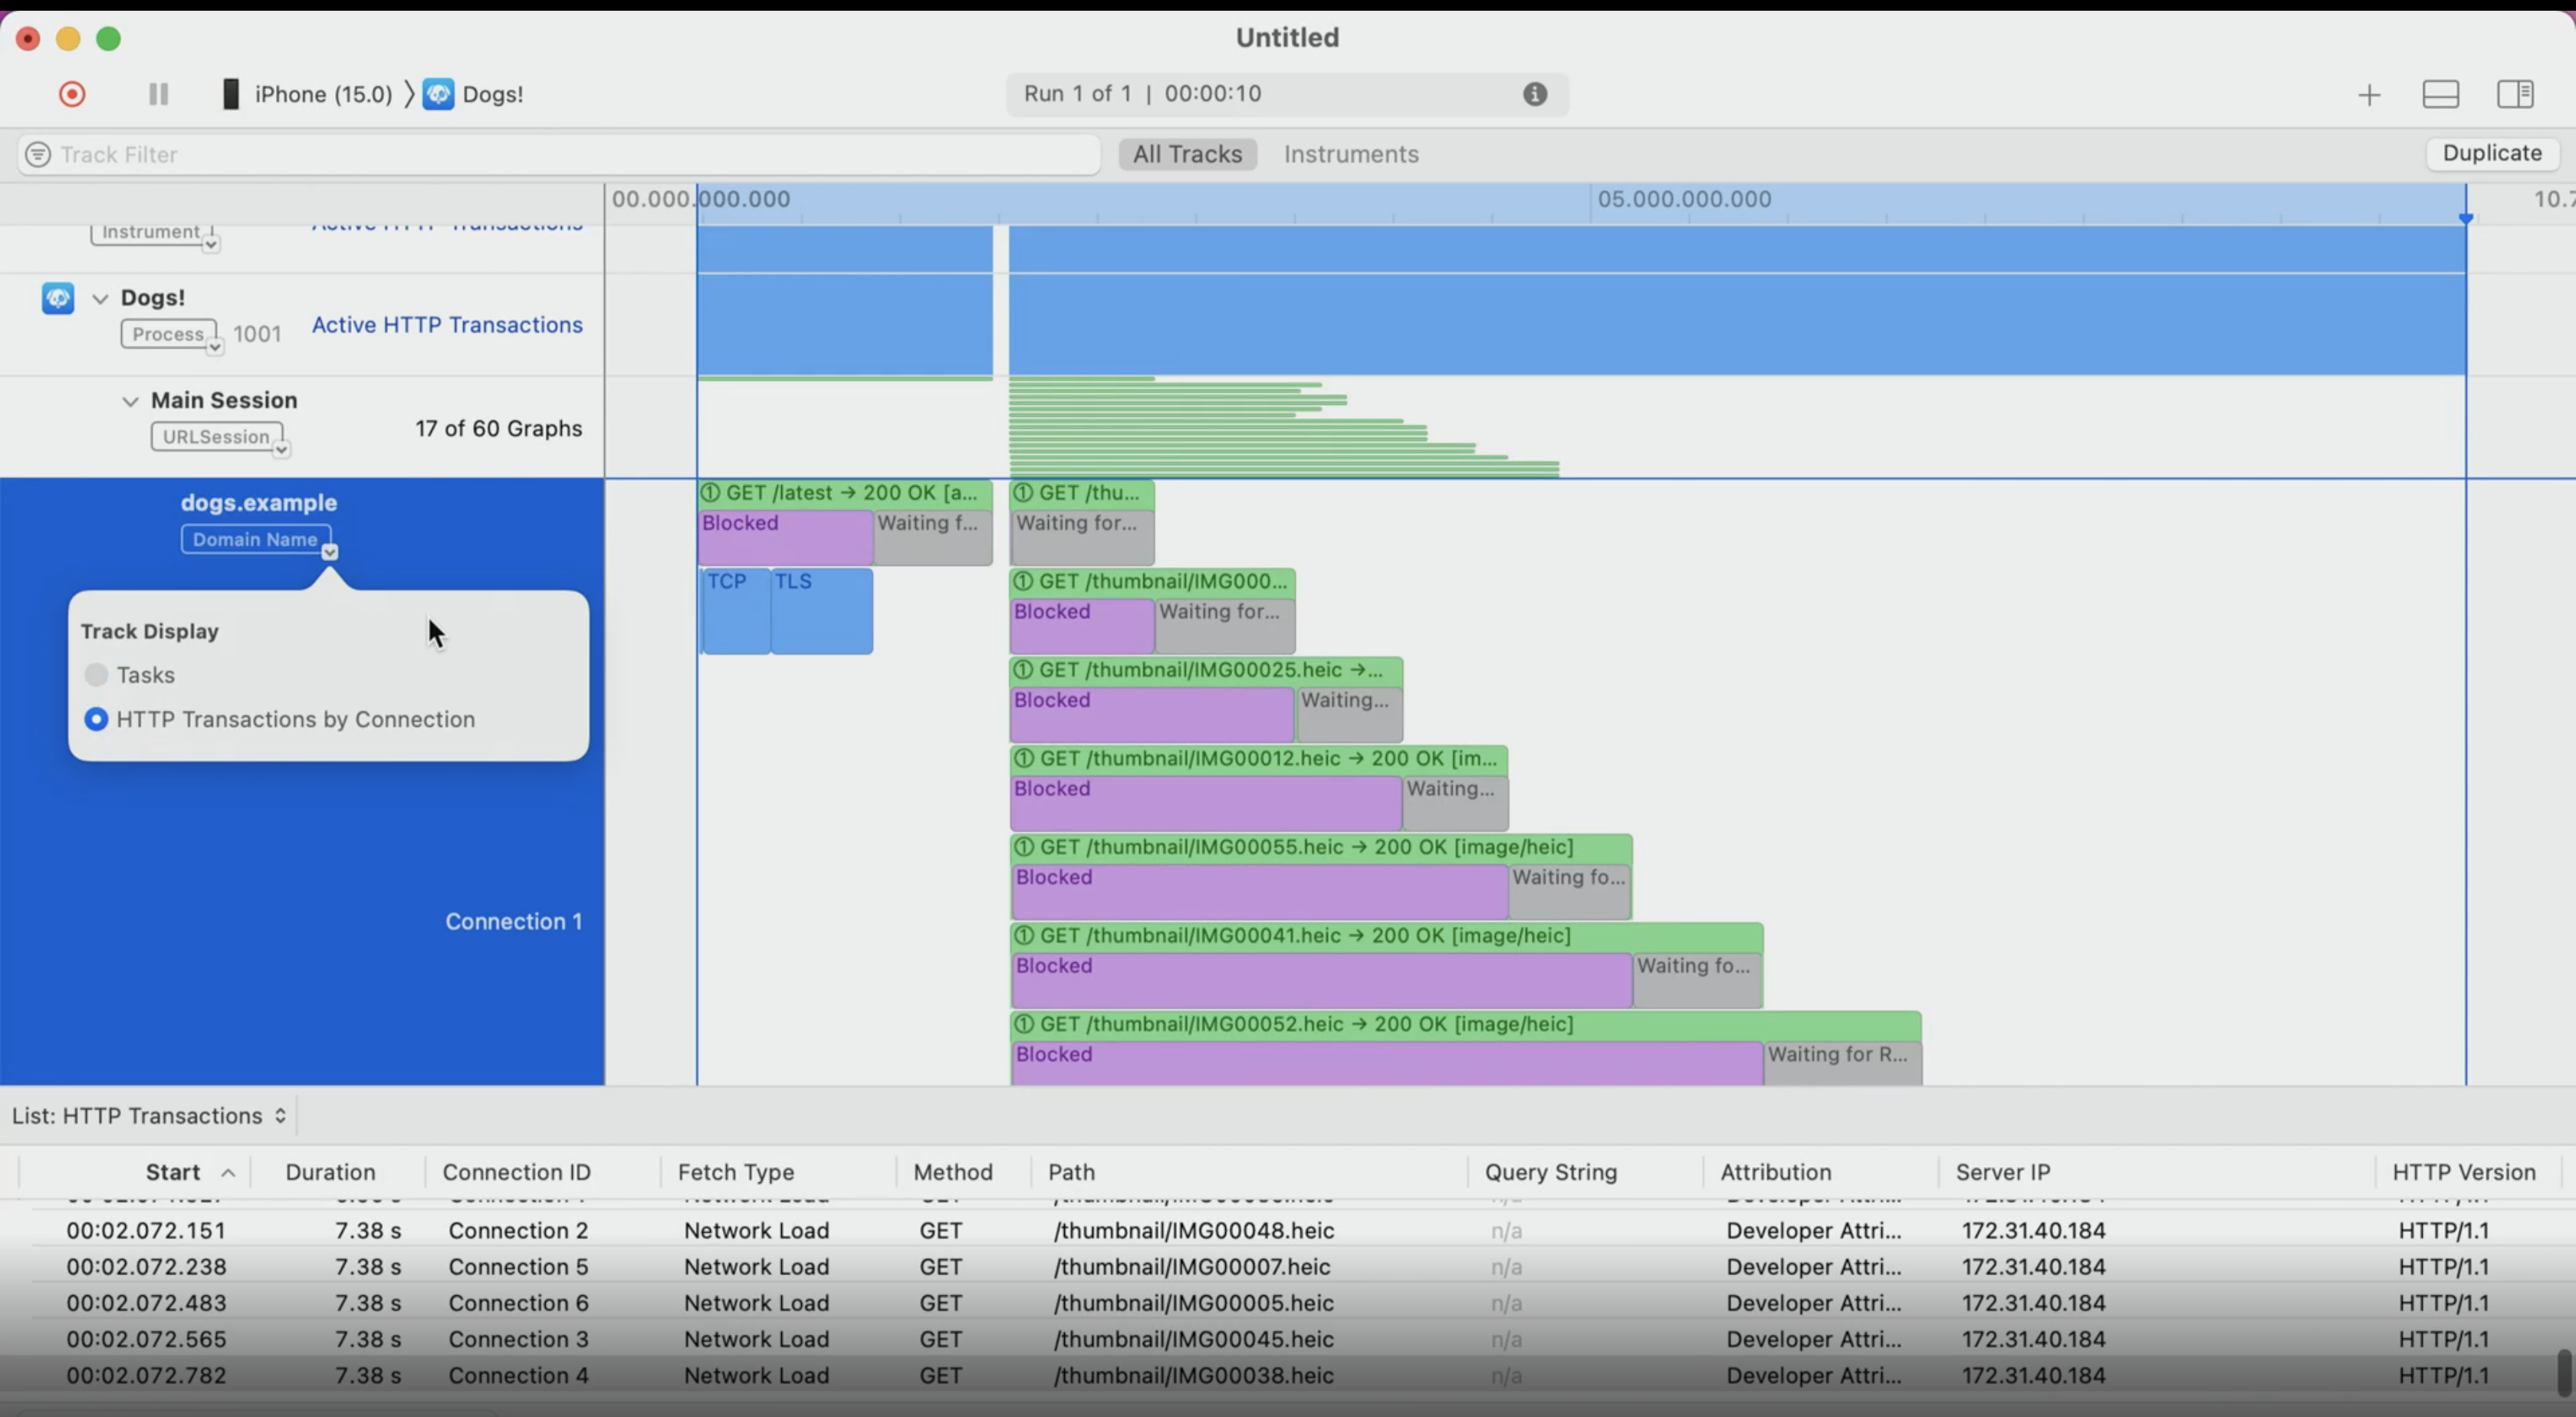
- Filter by connection
- Another great utilities are how we are able to filter the task by the connection instead of the tasks.
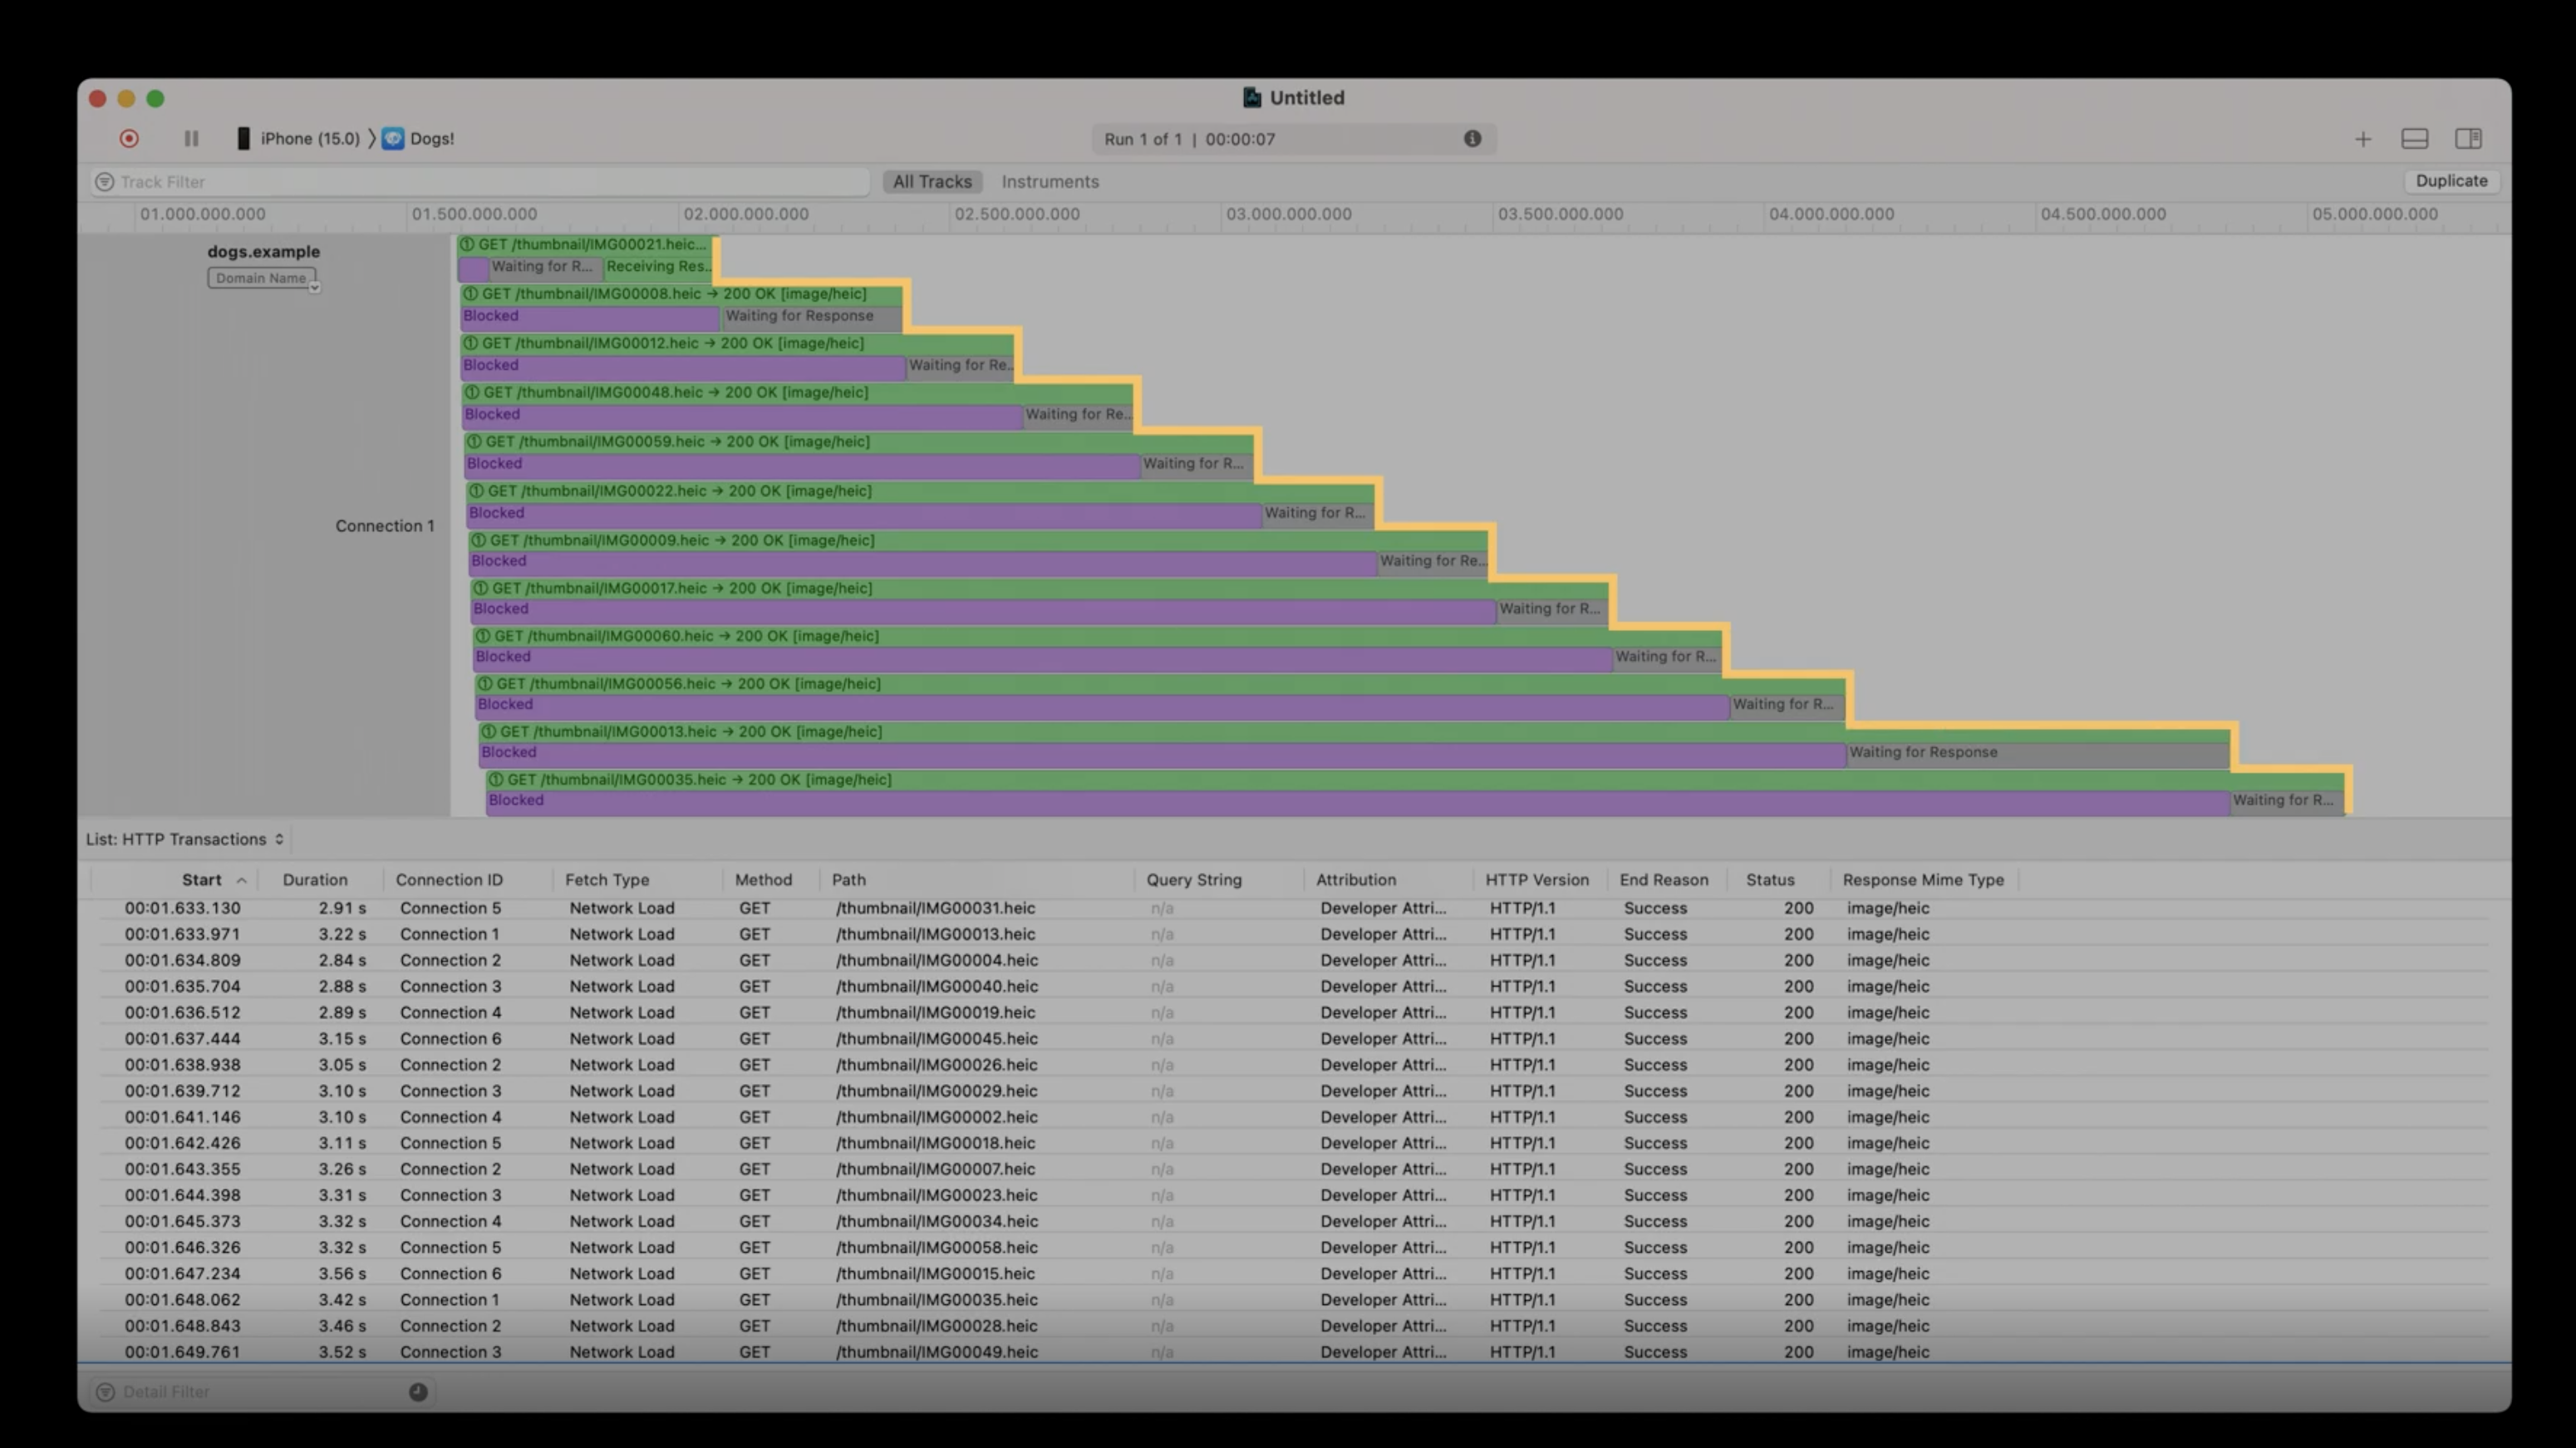
- Identify the http task issues (Ex: Staircase problem)
- We can also easily identify the task issues by see the pattern of the connection for each transaction. By an example is a staircase problem.
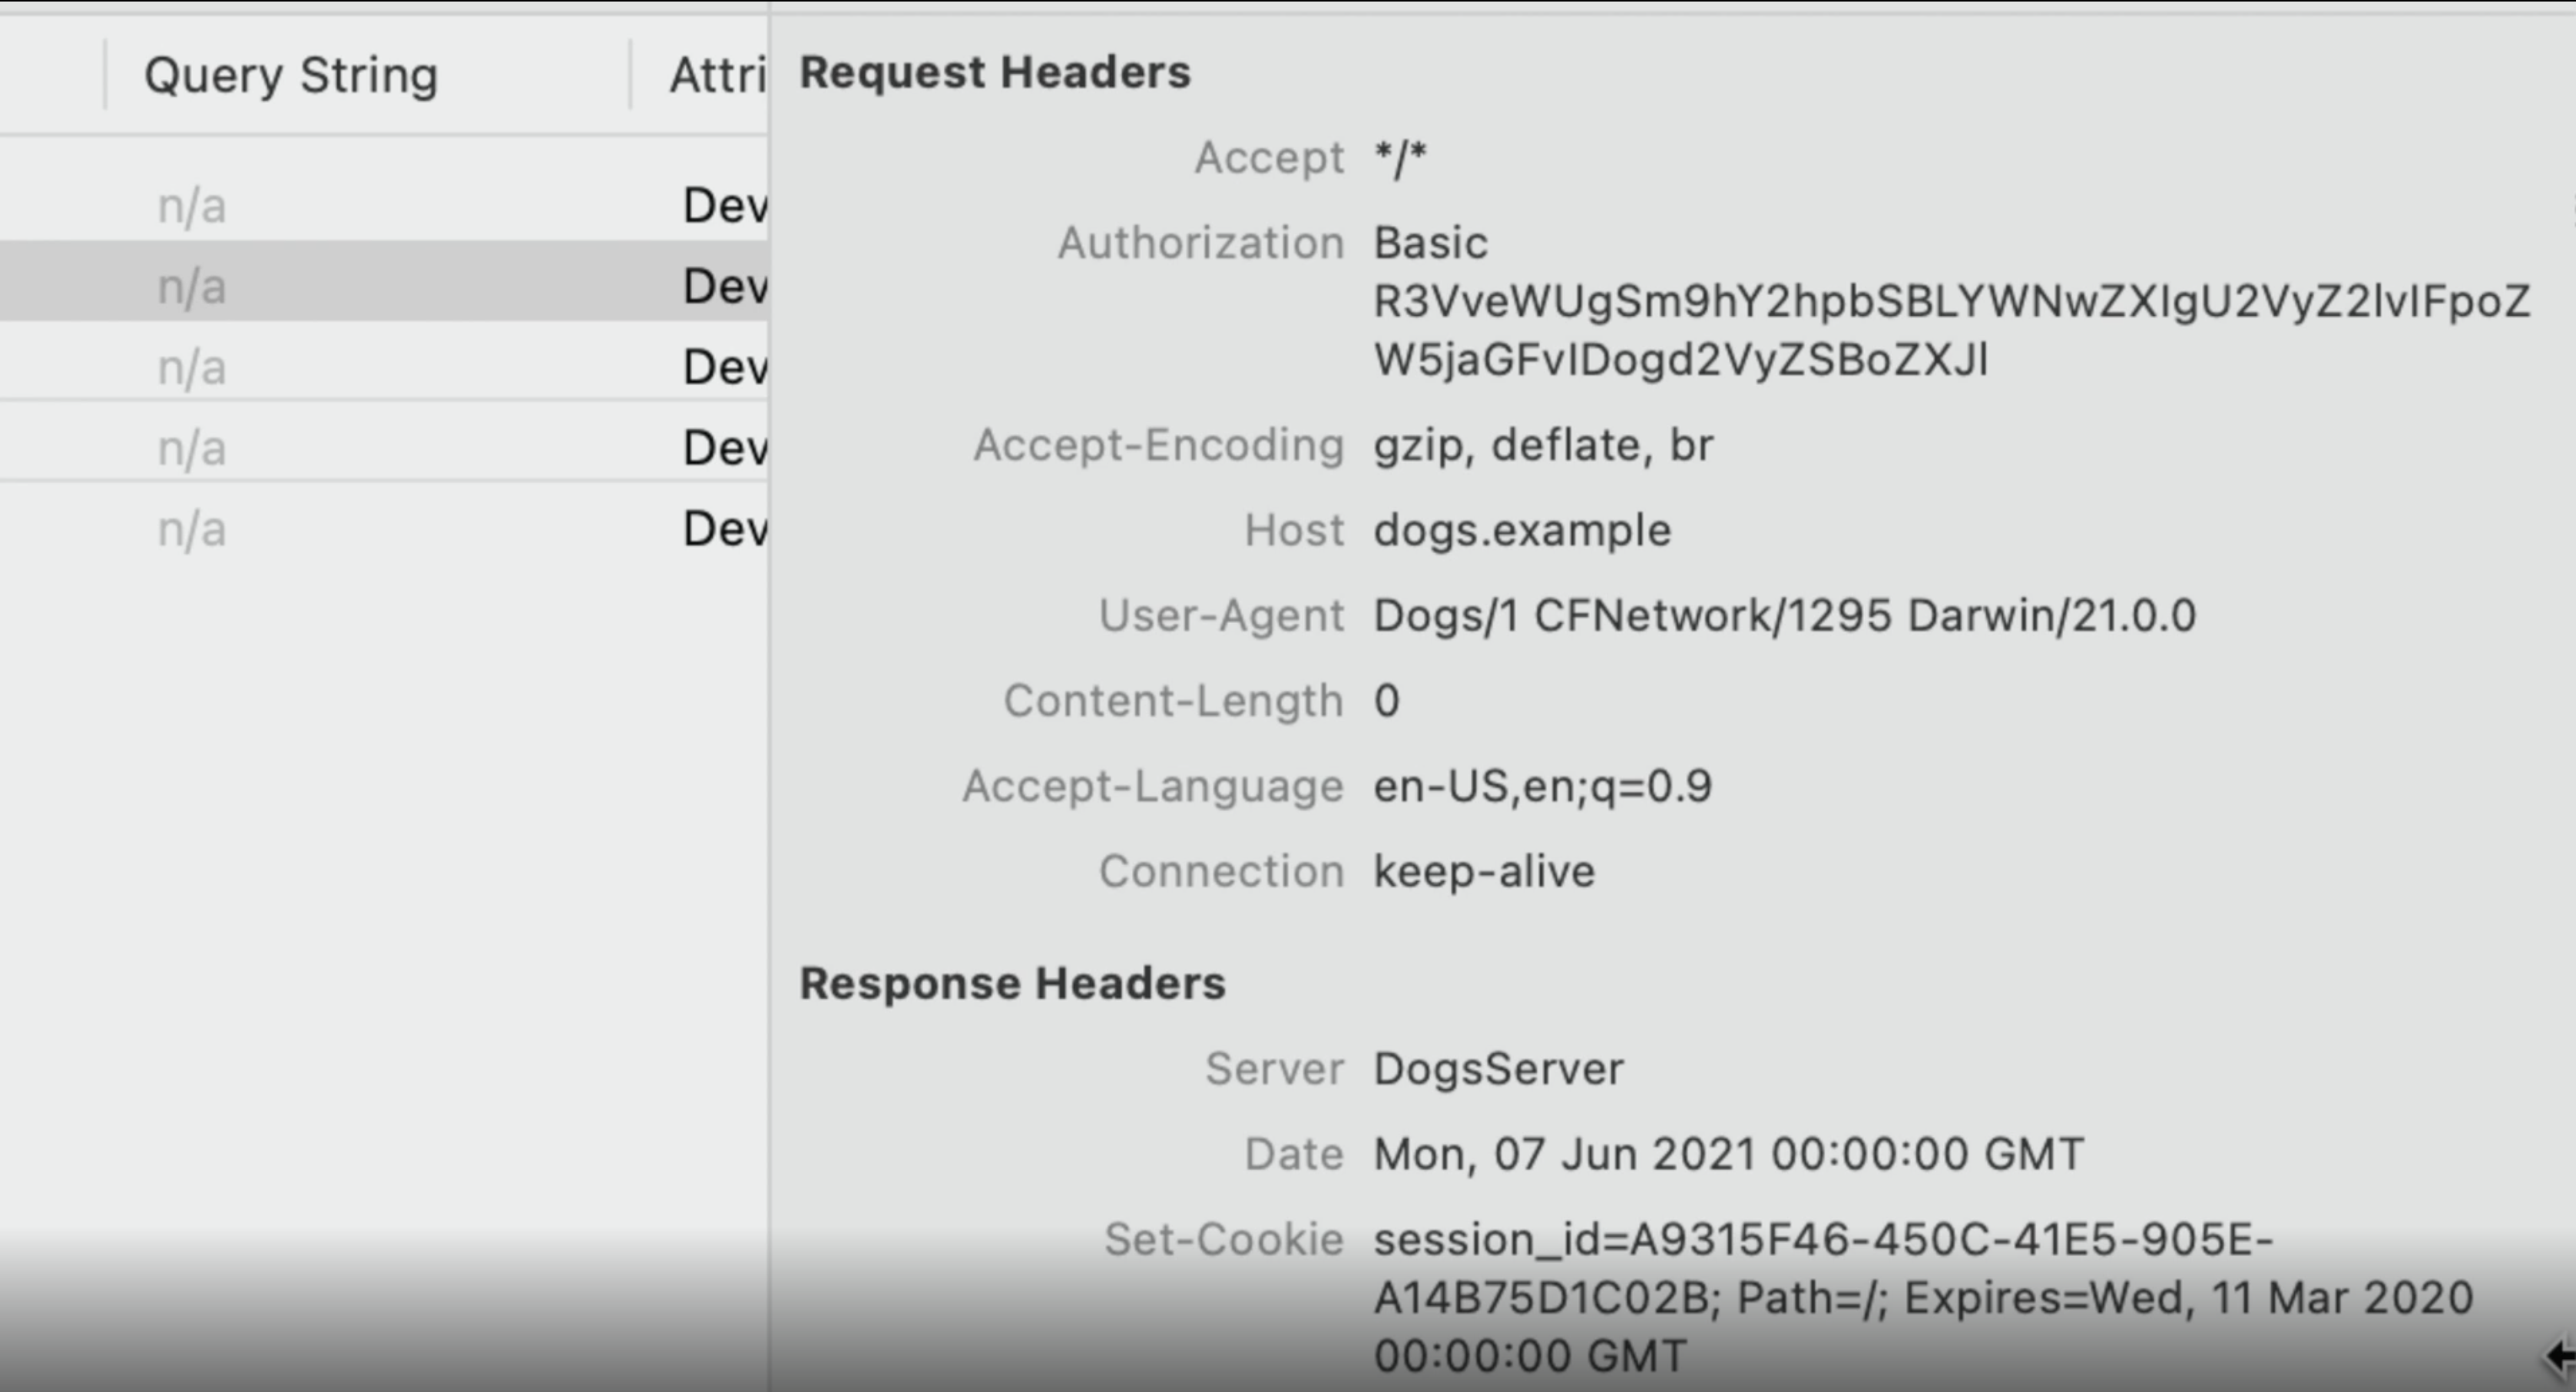
- Identify the request (Ex: wrong expiration date of cookie)
- Once we are able to identify the issues we can start to identify the request that we want to see. Click on the request, then filter by transaction list on the bottom left filter, and then you will see on the bottom right of the request information (extended detail view), and we can start reading each information. In this case, we found out the wrong expiration date of the cookie.
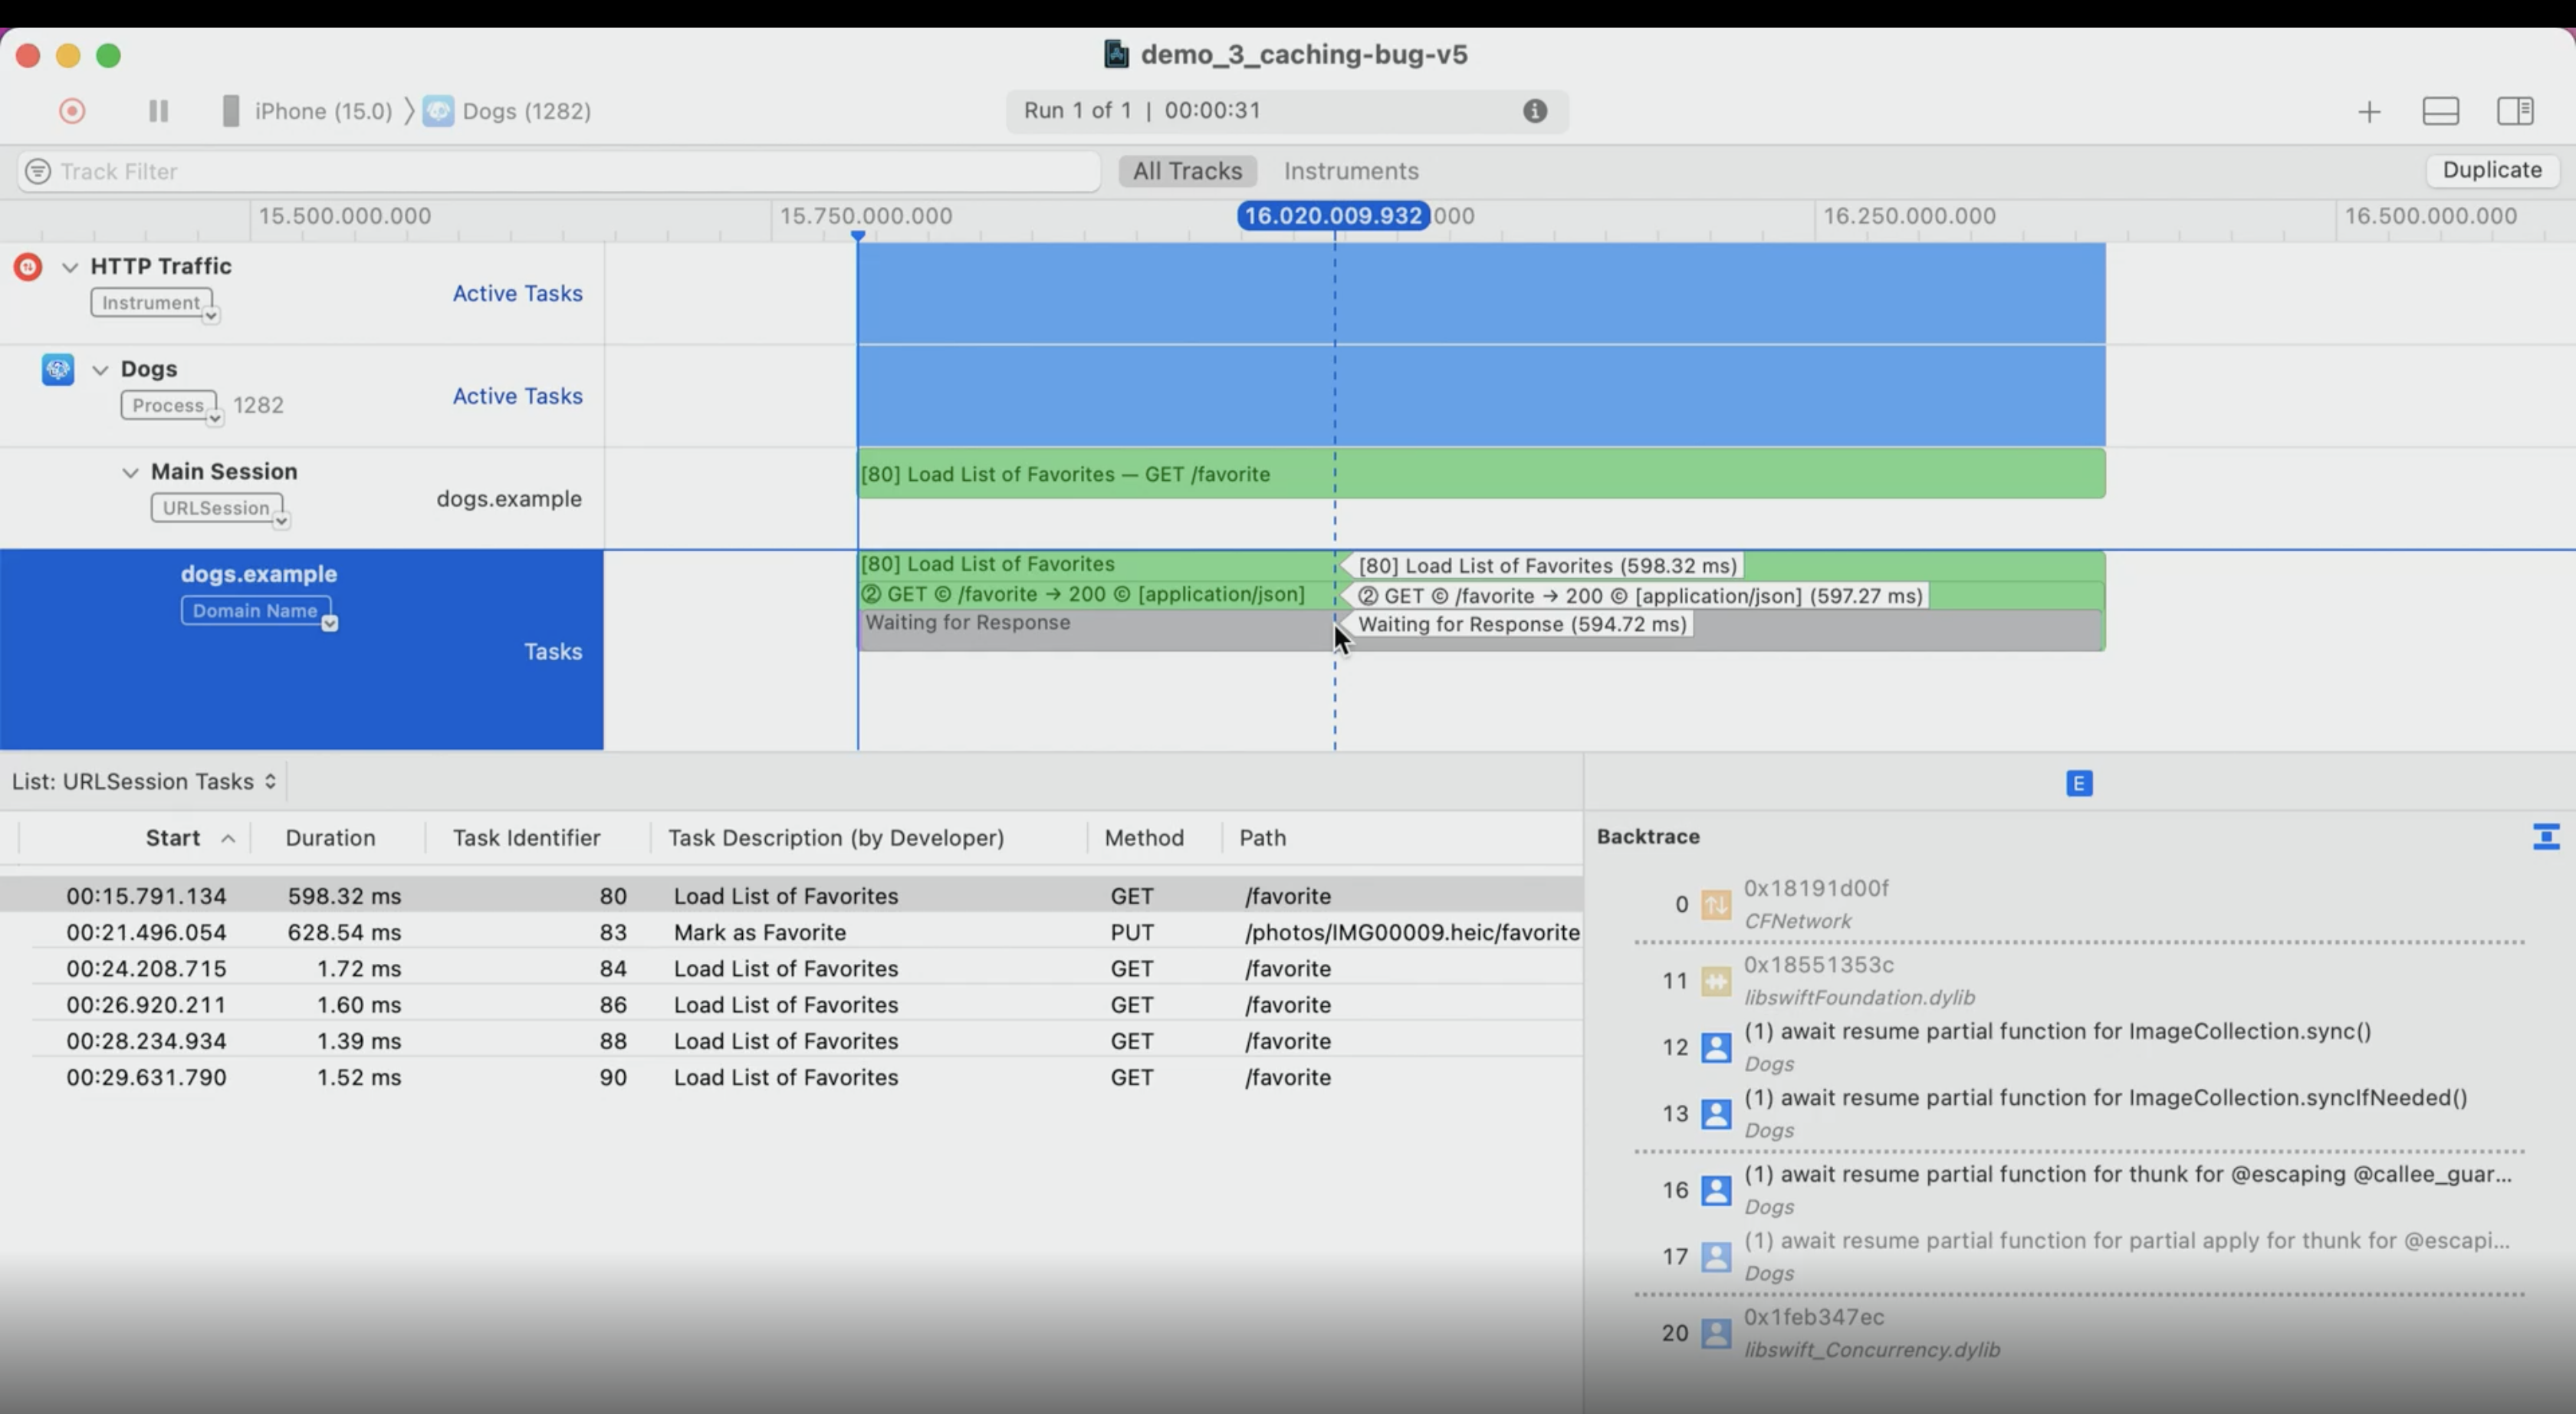
- Identify the backtrace (Ex: cached response)
- We can also to check the backtrace of the problem. The same step from before, however change back the list into URLSession Tasks, and on the bottom right you will see the backtrace and start identify each trace.
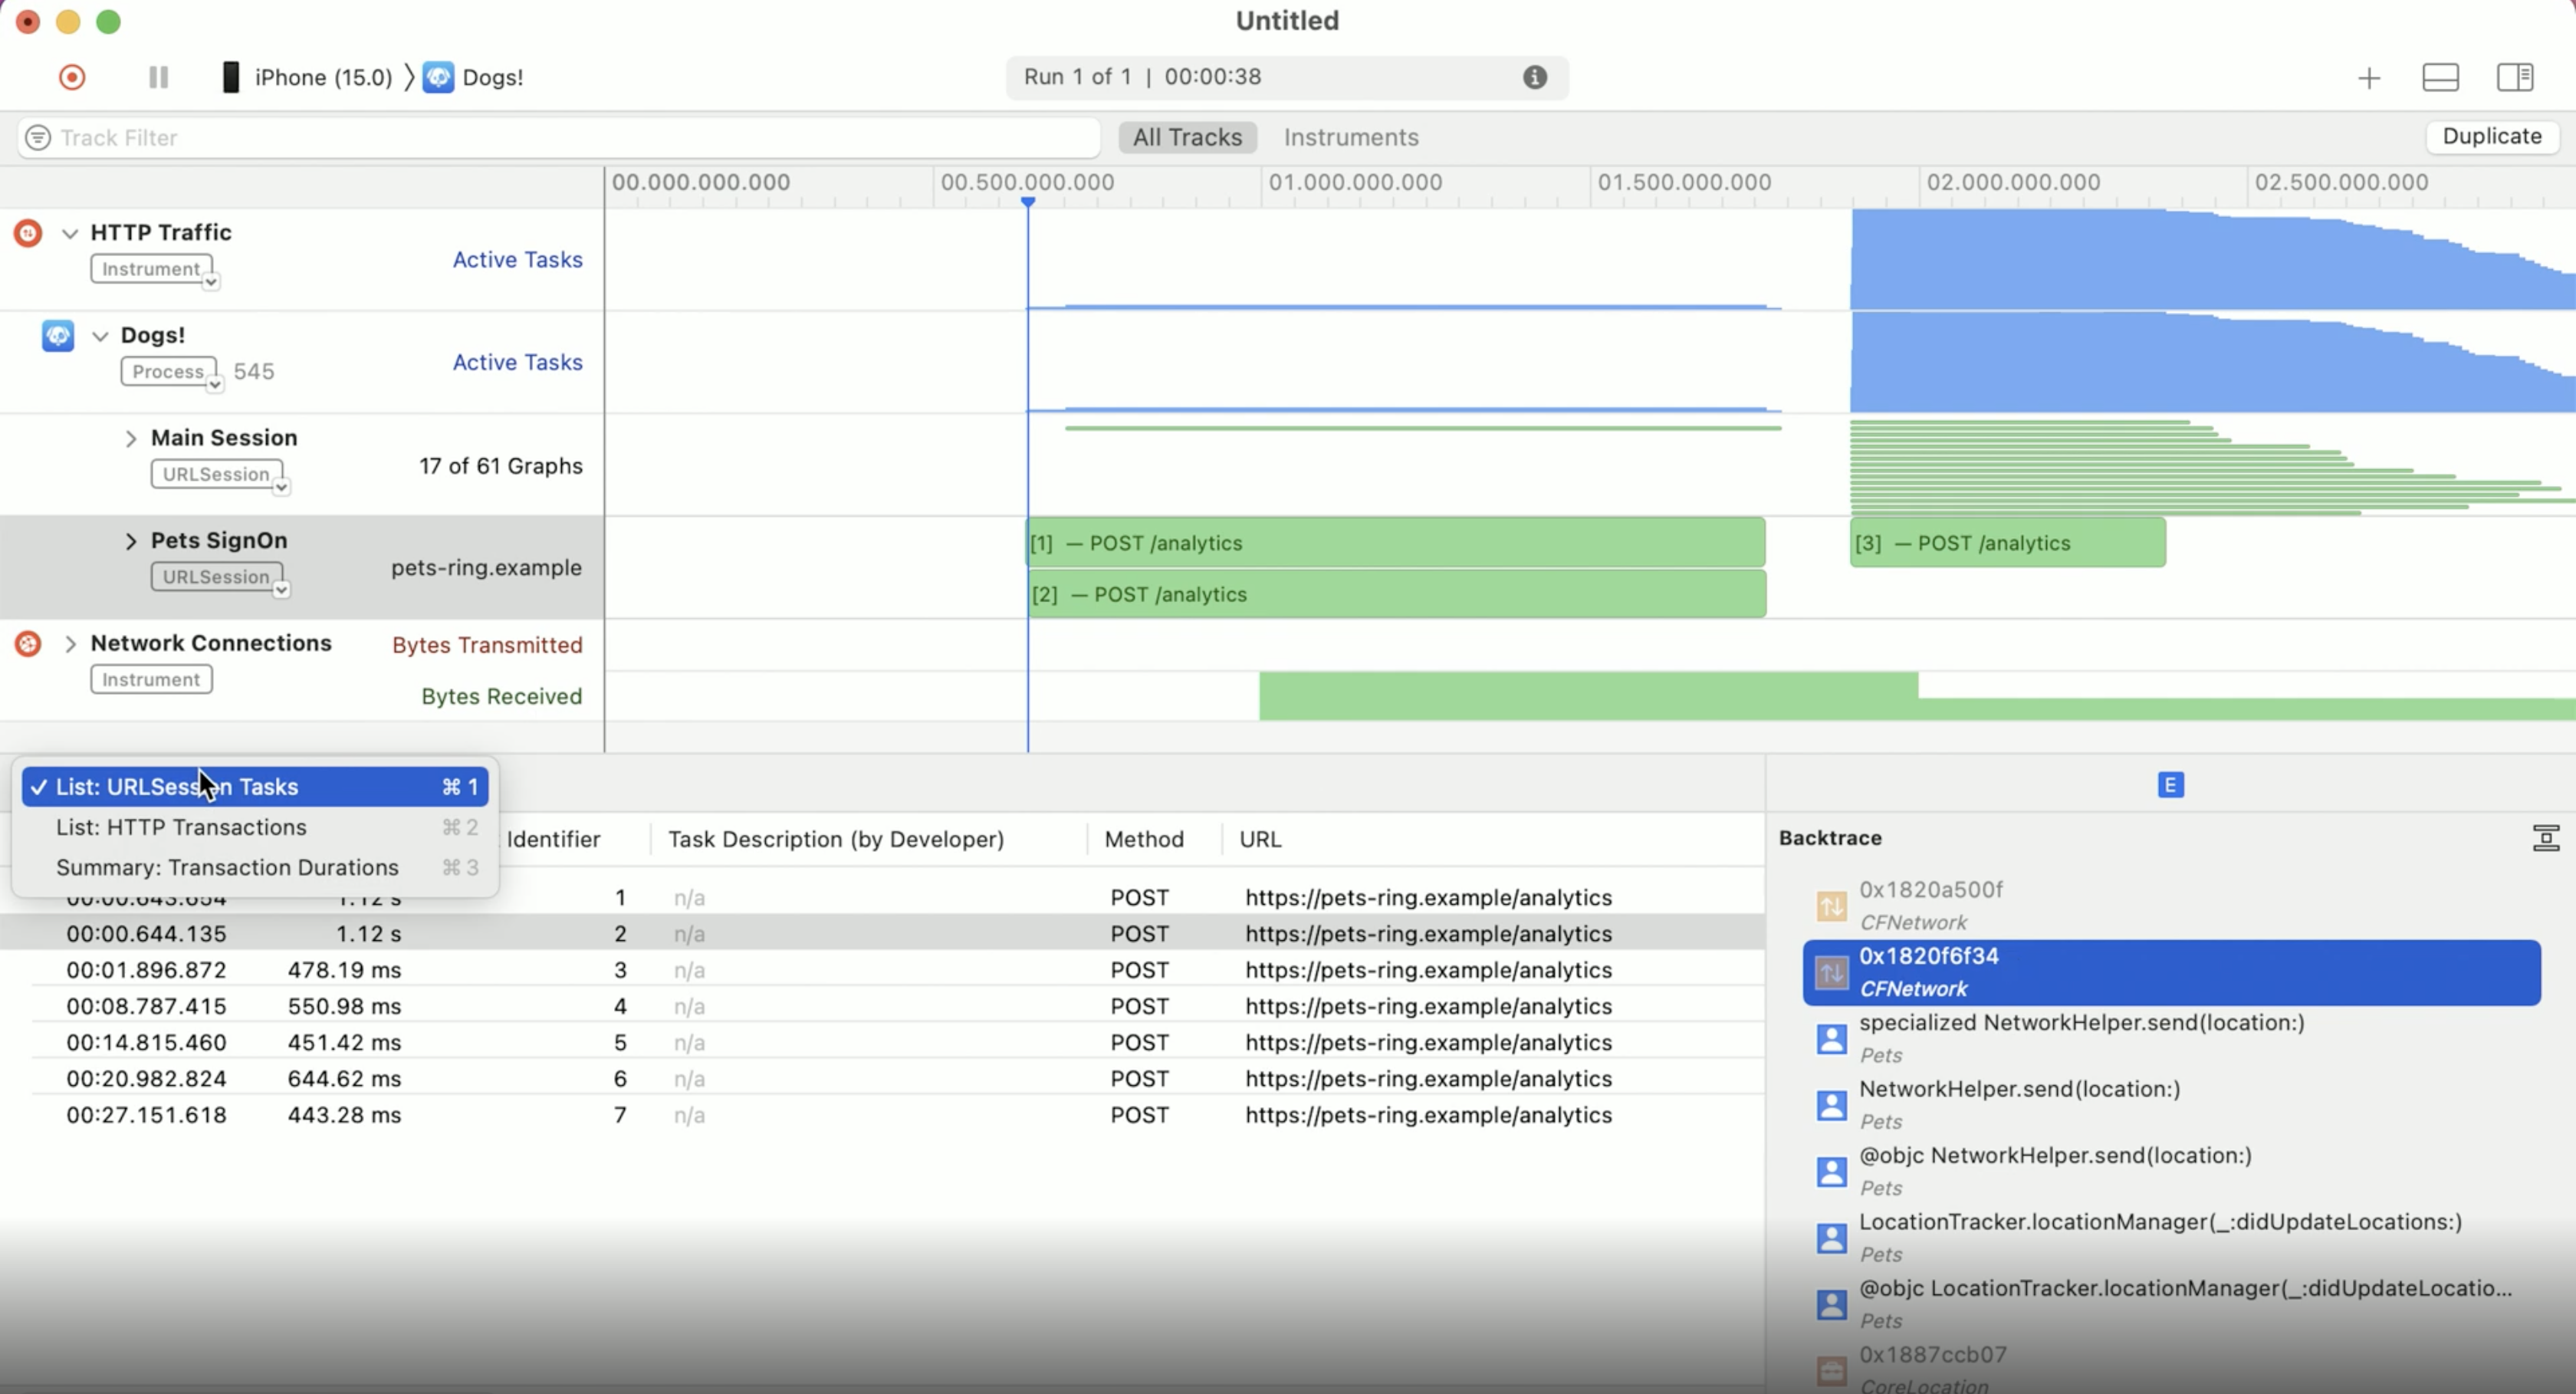
- Filter the session (Ex: Found an issue with the data that sent to server)
- As I have described on the step 5 and 6 we can filter out the session by the URLSession Tasks, Transaction List or Summary Transactions Duration.
- Export the report to .har extension
- One last unique thing is we can export our report to an
.harextension. First we need to save our trace by clickingFile -> Save As -> Save. Then we can use a command line to export it as.harextension.
xctrace export --input YourTrace.trace --har
- Output
- Save and export report to
.harto analyze the issues..haris a JSON structure so it is very convenient for reading the structure of the report.
{
  "log": {
    "version": "1.2",
    "creator": {
      "name": "xctrace",
      "version": "13.0"
    },
    "entries": [
    {
      "_transactionUUID": "BBSA-XXX",
      "_taskUUID: "0293-2093",
      "serverIPAddress": "182.19.40.111",
      "startedDateTime": "2021-05-27T09",
      // and more
    }
     // This JSON contains most of the trace report
    ]
  }
}
Conclusion
As conclusion, this session is really interesting session how Apple provide us more tools to help our development process without necessity of other third party tools for identifying bug of an HTTP Request. I would love to see how it goes and impact most of the team to reduce the amount of the bug that occur during a networking process.
Some tips from the WWDC21 10212 Session:
- Target app today to detect problems
- Name your
URL SessionandURLSessionTaskfor easier debugging - Adopt latest networking protocols
- Audit your app requests to check if it can send less information