Fun Debugging in iOS — Understanding the GUI in 3 minutes
Learn how to use easily debug in Xcode
After we have understood the basic concept of LLDB commands now it is taking time to understand the full GUI of Xcode debugging.
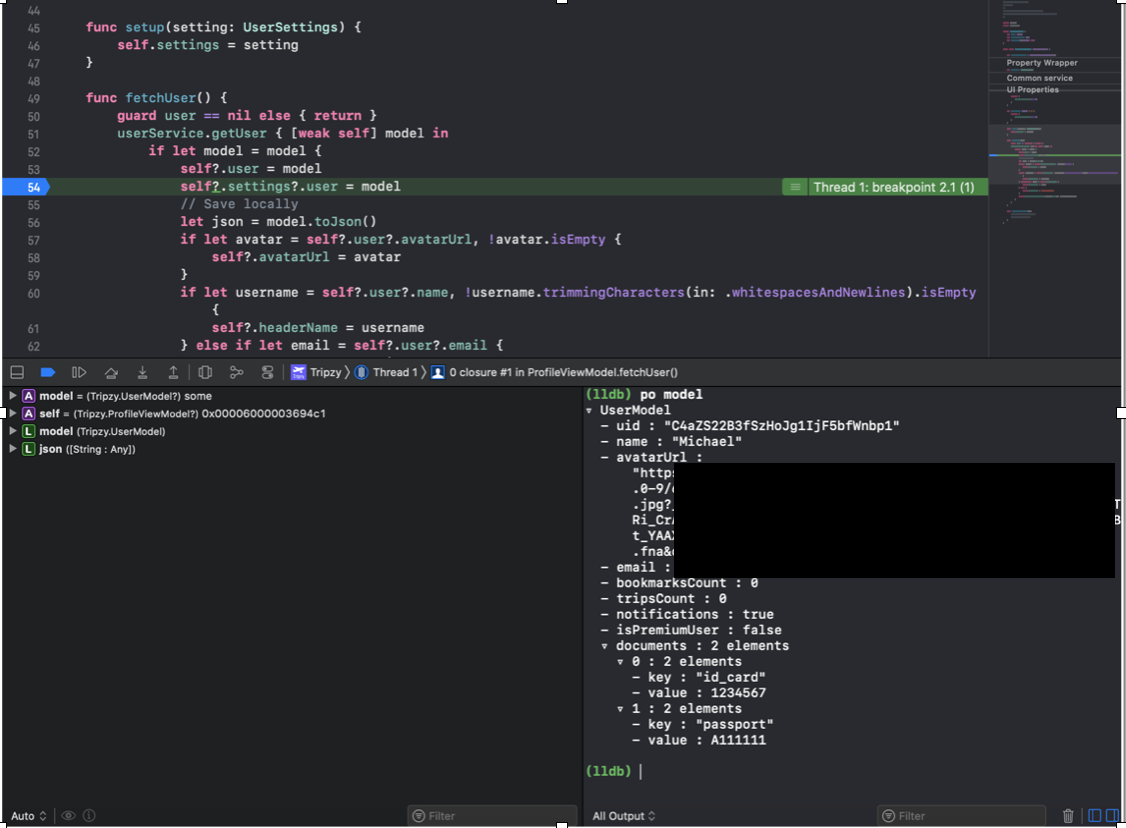
Let see the picture above. Once you have put a breakpoint on any lines of code in your applications, you will see a similar screen as above.
-
The top one is our code panel, which indicates where is our breakpoint located
-
The bottom left panel is our quick look panel, we can see our current state of the object in either class or function level at the moment the code is being halted
-
The bottom right panel is our console debugger whereas we can put a lot of LLDB command and expression in there
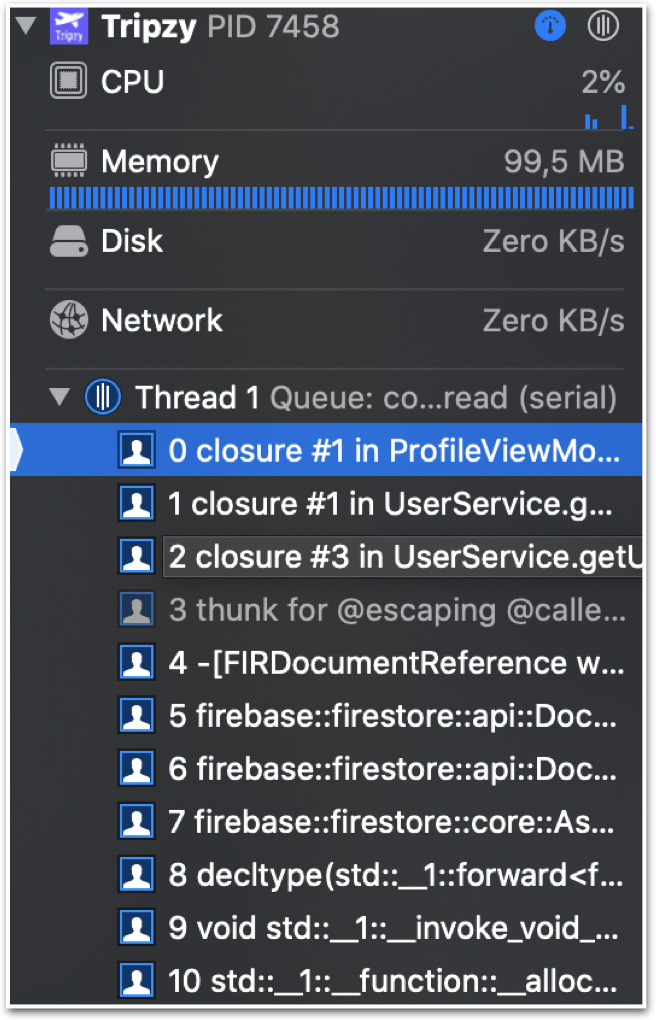
When you see on the left panel, you will see a full stack trace of your code. This stack trace is indicating the flow from where it is started until now at the moment the code is being halted. You can click on each line and investigate inside more deeply and analyze each part to identify and gather more results.
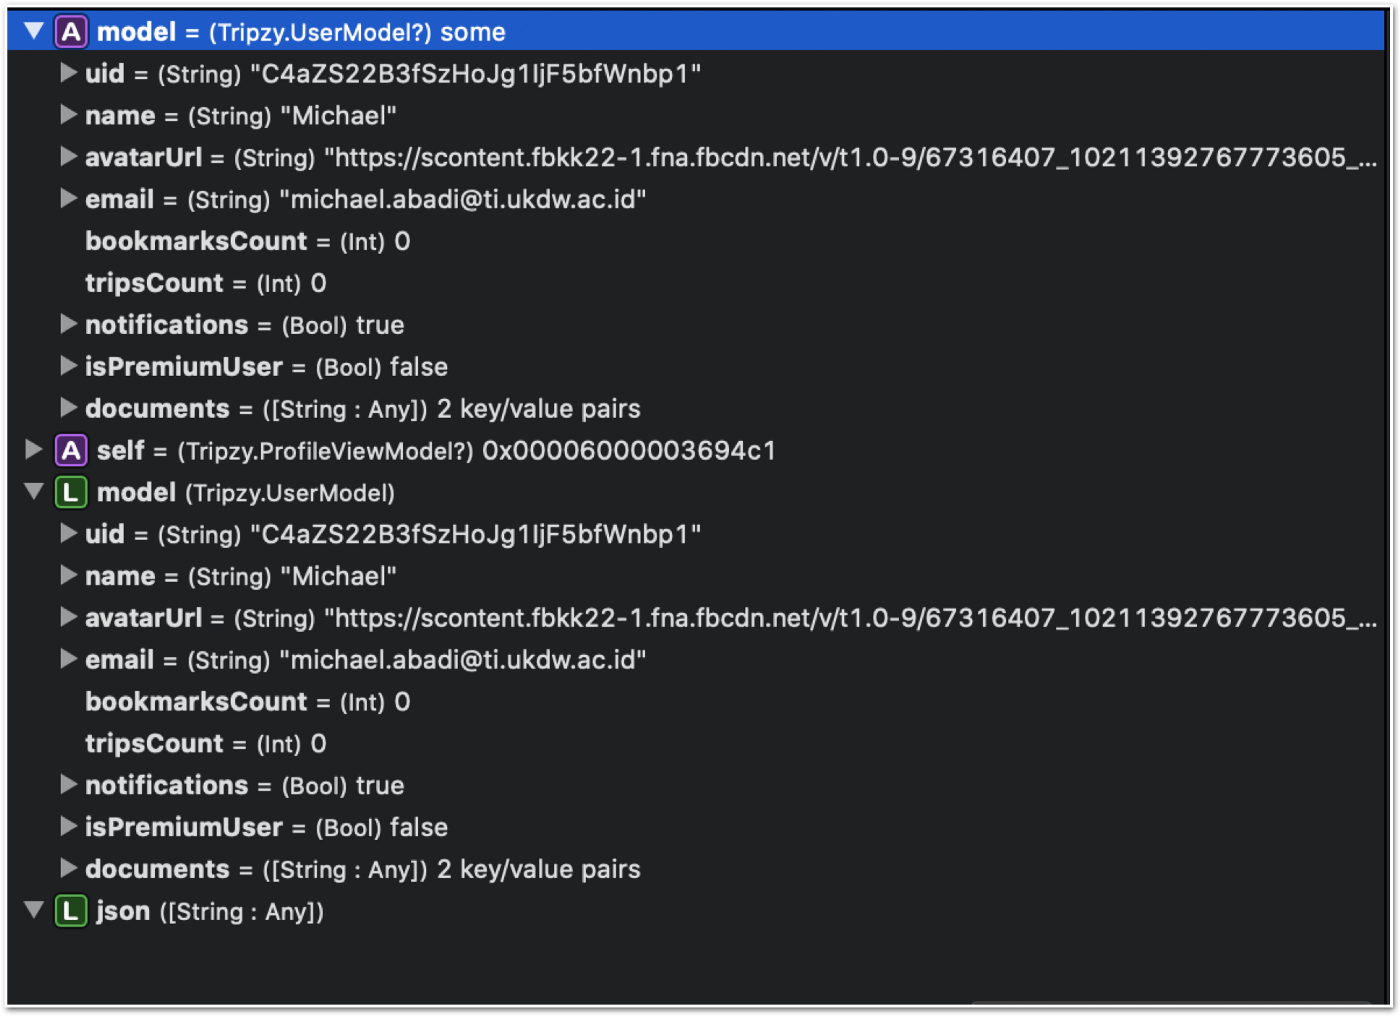
As I said previously, this quick look panel will help us understand more context to all of the current states of the properties in the class and function level before the code is halted. You can click the dropdown arrow to lookup deeper on it, or click the space button or eye button to each property to see as well. We can also identify UIView state in this quick look which is very helpful for UI Debugging as well
-
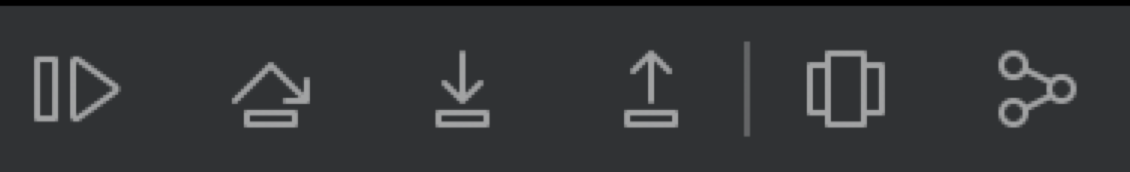
This panel, which is located in the middle, start from left to the right
-
Pause-continue button this button is useful for a start, pause and continue the execution of the code after a breakpoint is started
-
Step over, this one is very helpful for executing the exact line after the blue breakpoint, so it will not go inside to the function inside in case your breakpoint is stopped at a line of code that pointed to a certain function
-
Step in, this one is very helpful for going inside to the certain function that halted because of the blue breakpoint. We can identify more what happens inside that function that lives inside the function (Function inside a function)
-
Step over, this one is very helpful if you want to go out from the current function, mostly used after you do step in, and you want to step out to go to another debug process
-
View Hierarchy debugger, this one is helpful for capturing the current state of of the UI, and we will get a full stack of layers of our UI
-
Object Graph Debugger, this one is helpful for capturing the current memory state of your application at a specific time

Last but not least this blue panel above is the one for putting other necessary breakpoints (Generic breakpoints) in our Xcode, which I will explain in other articles. Stay tuned for more articles!