Fun Debugging iOS — Basic Part (LLDB) in 3 minutes
Learn understand basic concept of LLDB in Xcode
Have you ever wonder how to debug your entire code in the proper way? But sometimes we don’t know in-depth detail about how does it work behind the scene? In this multiple series of articles, I am trying to spread multiple articles into specific chunks of debugging part, start with the basic / foundation part of debugging in iOS. Normally we will have multiple topics covering all areas, start with LLDB debugging and end with Logging.
What is LLDB? LLDB stands for Low-level debugging which in iOS it will support multiple ways of debugging specifically only for iOS targeted application languages such as Swift, Objective-C, C++, and all Apple environment applications. For most Mac and iOS developers, LLDB is the most commonly used debugging tool besides Xcode interface breakpoint debugging.
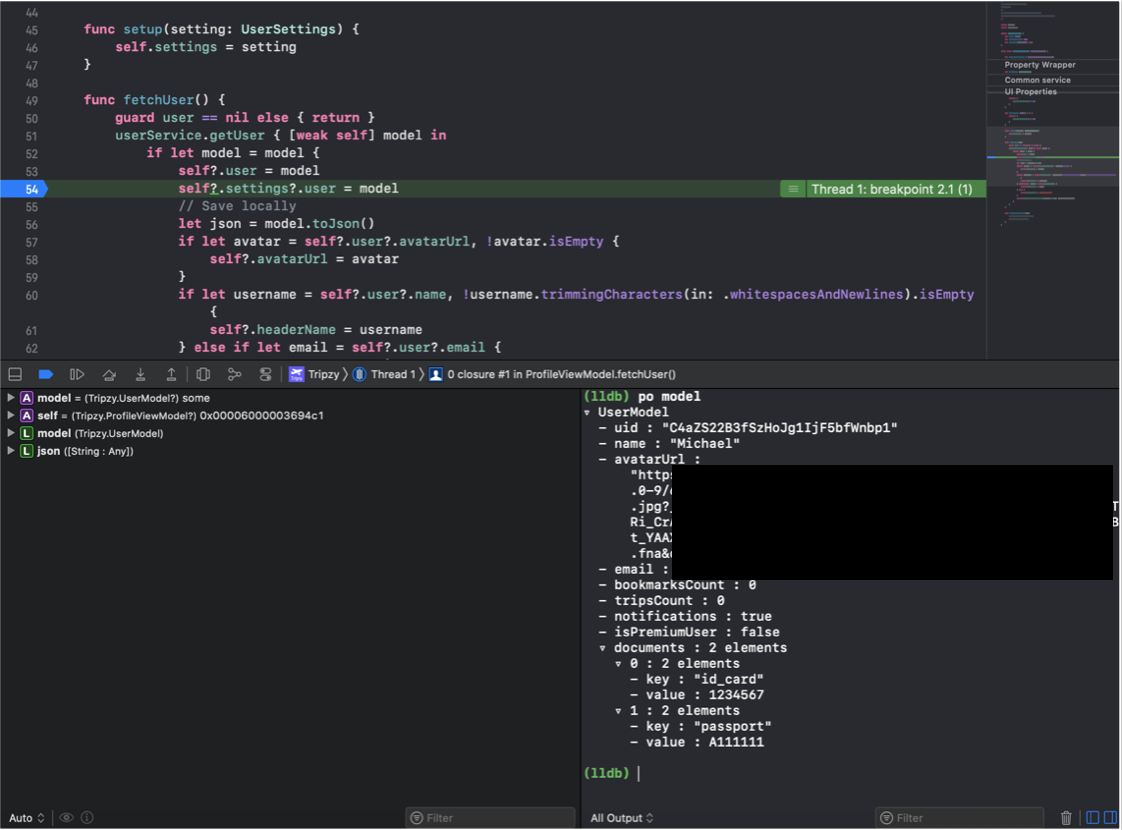
Above is an example of LLDB debugging in one of my own applications. We can see that we can easily put blue breakpoints in any line of the code we want and then in the bottom right in the debug console, we can do any expression and command in there. There are a lot of expressions that can be used as described here, but we will mainly focus on three commands that widely used:
- p
- v
- po
P
So p is the way to print out variables and is also equivalent to typing expr comment and p is actually an alias for expr . See this example below
(lldb) p model
(tripzy.UserModel) $R2 = (id = “c45sd13”, name = “Michael”, email = "michael.xxx@xxxx.com")
The output is quite equivalent with po, but it is slightly different. The output above has been given a name $R2 . This is part of LLDB’s convention of naming output variables with incrementing numbers. Hence p $R2.name is a valid command and will produce the expected output “Michael”.
LLDB generates source code from p command and then compiled using the embedded swift and clang compilers before being executed however the type is being verified during runtime that we called Dynamic Type resolution, thus sometimes we may not able to debug correctly if we don’t cast a type-specific to a certain identity.
V
v is an alias for frame variable command to print variables in the current stack frame. This command is new command since Xcode 10.2
(lldb) v model(tripzy.UserModel) model = (id = “c45sd13”, name = “Michael”, email = "michael.xxx@xxxx.com")
v command is faster because it doesn’t compile and execute any code at all. Even you can do something like below.
(lldb) v model.name
(String) model.name = “Michael”
However v has some drawbacks because it doesn’t compile and executed any code then if we found some cases that object need to be executed in order get the value v easily fail immediately, example v model.fullname which is a computed property that will be failed. However behind the scenes, v performs dynamic type resolution, before formatting the output and printing it to the console, hence some cases that p and po need to cast beforehand will be better to perform in v
PO
Lastly, po is one of the most used commands that is being used widely in the world. Why? Because it gives us the current state of our object in the proper structure that gives more context and readability to the object. po command also execute expressions that are valid within the scope of the breakpoint, if it is not then it will quickly throw an error to the console.
po model
Above will result in the very proper structure of our object state in the debugger console. However keep in mind, it performs slower than the other two and it doesn’t resolve in Dynamic Type resolution.
After we analyze these 3 commands we can easily choose and pick which one we need to use depend on the use cases on our projects, which one you prefer? Faster execution of debug command? Then choose v. More detailed information then use p. Don’t care much about those two and want to has more readability and quick to validate? use po.